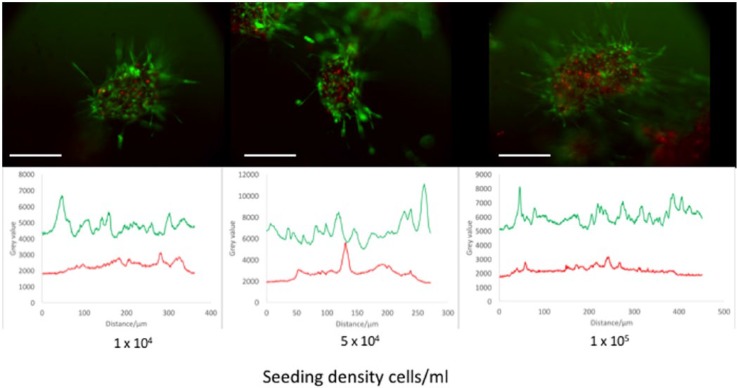
Figure 5.
The cross-sectional viable (green; FITC) and dead (red; TRITC) fluorescent signal in spheroids with different cell seeding densities. Peaks in the graphs indicate an increase in signal. Note the higher level of FITC signal throughout the spheroid compared to TRITC, which has occasional peaks, more towards the centre of the spheroid. Scale bar = 200 µm.

