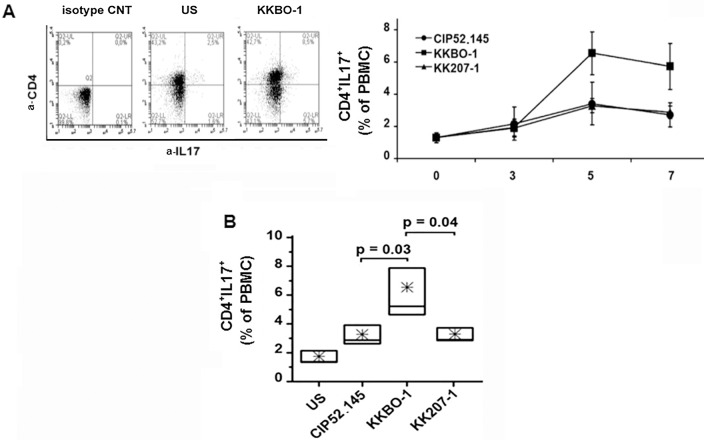
Fig 2. Differentiation of CD4+ T lymphocytes induced by K. pneumoniae strains.
PBMC from 6 healthy donors were cultured at 106/ml for 7 days with UV-inactivated bacterial cells at 1:10 ratio. Cells were recovered at the indicated times, stained with anti-CD4-APC and anti-IL-17A-FITC and analyzed by ACCURI instrument using the CflowPlus software to process the data. The area of positivity was determined by using an isotype-matched control mAb. Representative scatter plots at day 5 are shown. Panel A: Time course analysis of Th17 differentiation. Data are expressed as percentage of CD4+IL17+ (mean ± SE). Panel B: Percentage of TH-17 cells after 5 days of culture with bacterial cells (n = 6). The boxes extend from SE, with a horizontal line at the median. An asterisk indicates the mean value. Statistical analysis was performed by Student’s t-test and One-Way ANOVA and p ≤ 0.05 was considered significant.

