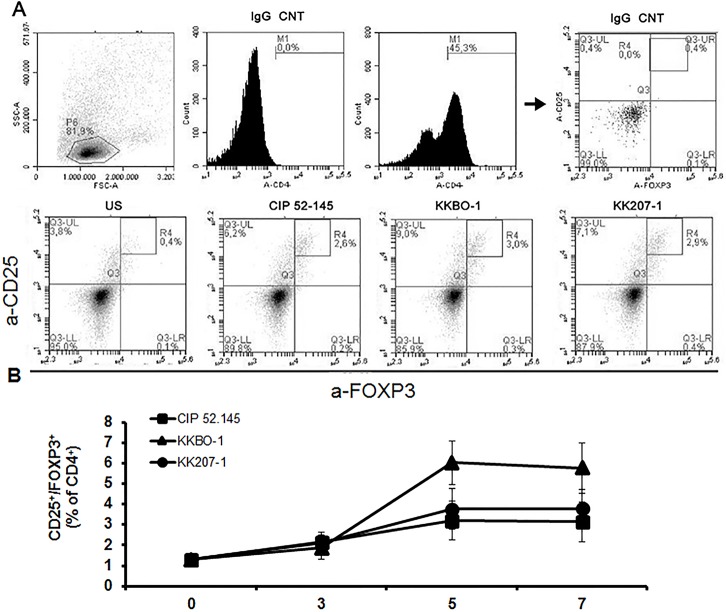
Fig 4. T regulatory cells induction in PBMC cultured with K. pneumoniae strains.
Frozen PBMC from 6 healthy donors (already included in the study) were thawed and cultured at 106/ml with UV-inactivated bacterial cells at 1:10 ratio. At time 0 and after 3, 5, 7 days of culture cells were stained with and anti-CD25-PE antibodies followed by intracellular staining with anti-Foxp3-APC antibodies and analyzed by ACCURI instrument, using the CflowPlus software to process the data. The area of positivity was determined by using an isotype-matched control mAb. Representative scatter plots at day 5 are shown in Panel A. Panel B show the time-course analysis of T regulatory cells (CD4+CD25highFoxp3+) differentiation in the PBMC population. Data are reported as mean percentage ± SE of 6 different experiments. Statistical analysis was performed by One-Way ANOVA and p ≤ 0.05 was considered significant; no significant differences were revealed.

