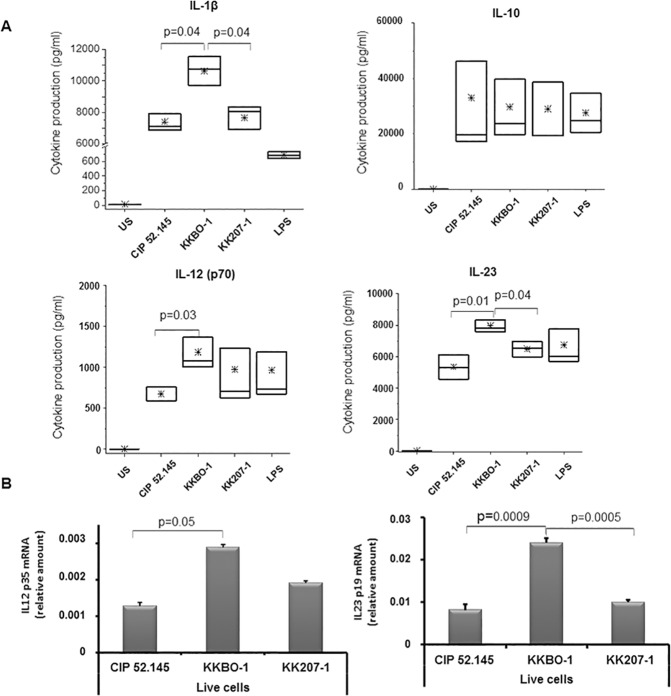
Fig 6.
Panel A. Cytokine production by MDC cultured with K. pneumoniae strains. MDC from 6 different healthy donors were cultured with UV-inactivated bacterial cells at 1:10 cell ratio for 16 hours. Cytokine concentration was measured in culture supernatants by Immunoplex array. The boxes extend from SE, with a horizontal line at the median. An asterisk indicates the mean value. Statistical analysis was performed by Student’s t-test and One-way ANOVA. p ≤ 0.05 was considered significant. Panel B. Expression of IL-12 and IL-23 mRNA by MDC cultured with live bacterial cells. 106 MDC (n = 3) were cultured with 106live bacterial cells (MOI = 1) for 5 hours. At the end of culture, cells were lysed to obtain mRNA. The expression of IL-12 and IL-23 gene was evaluated by RT-PCR by using specific primers. Results are expressed as relative amounts (2-ΔCT) of mRNA. Data from 3 different experiments (mean ± SE) are shown. Statistical analysis was performed by Student’s t-test. p ≤ 0.05 was considered significant.

