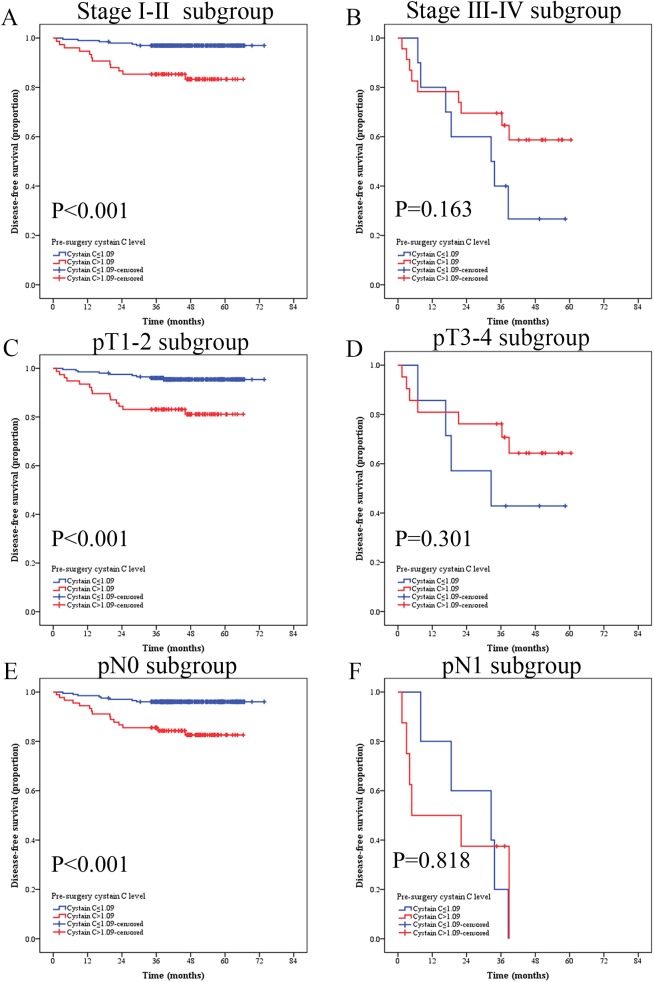
Fig 5. Kaplan-Meier curves depicting disease-free survival (DFS) according to preoperative cystatin C levels in 306 patients with renal cell cancer.
Patients were stratified according to the pT-status, pN-status, and pM-status. (A) Kaplan-Meier analysis of DFS in Ⅰ-Ⅱsubgroup; (B) Kaplan-Meier analysis of DFS in III-Ⅳsubgroup. (C) Kaplan-Meier analysis of DFS in T1-2 subgroup. (D) Kaplan-Meier analysis of DFS in T3-4 subgroup. (E) Kaplan-Meier analysis of DFS in N0 subgroup. (F) Kaplan-Meier analysis of DFS in N1 subgroup.

