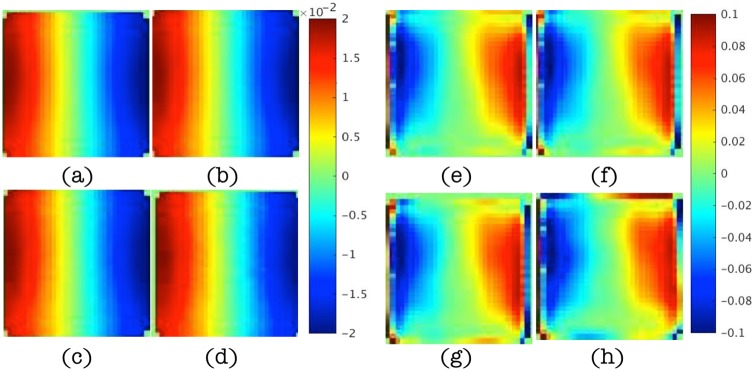
Fig 4.
(a-d) Maps of the real displacements, u, in the x direction at slice y = 4.2cm for noise levels of 1%, 5%, 10% and 15%, respectively. (e-h) Corresponding maps of ∇ ⋅ ∇u estimated from polynomial fitting of the displacement data. Images in (a-d) are displayed in units of mm and images in (e-h) are given in units of cm−1.

