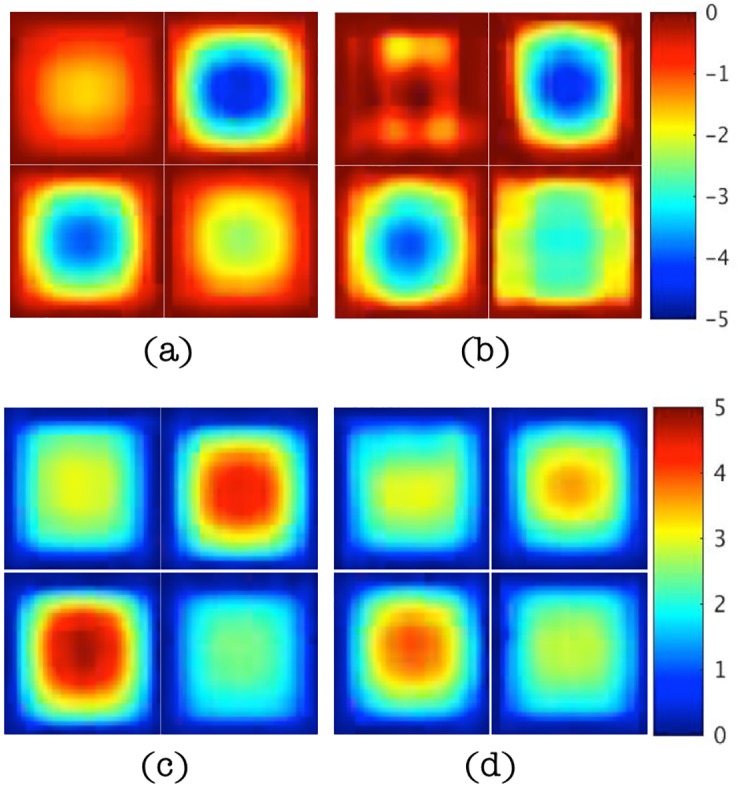
Fig 5. Estimated pressure, p, images at y = 0.8cm, 3cm, 4.2cm and 5.4cm in left-right clockwise orientation from 1% noisy data in the two parameter case.

(a-b) Real part of the pressure field from GFP (true, left) and IFPI (estimated, right), respectively. (c-d) Imaginary part of the pressure field from GFP (true, left) and IFPI (estimated, right), respectively. Images appear in units of Pa defined by the scalebars shown.
