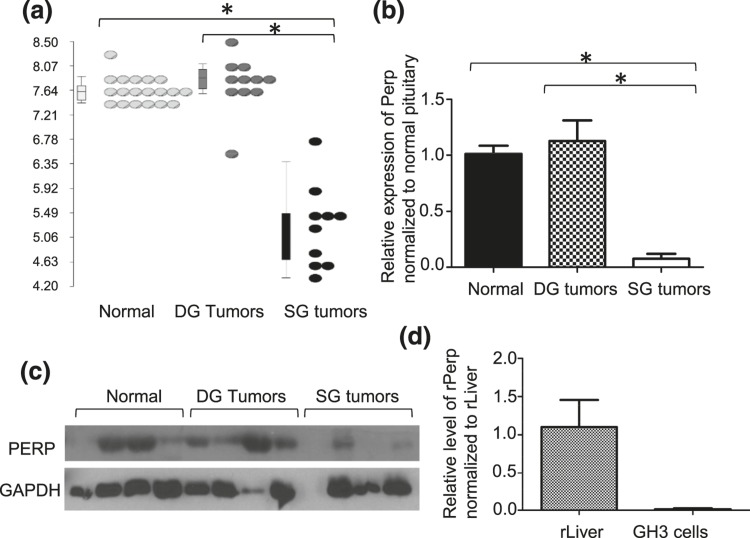
Figure 2.
PERP is downregulated in SG compared with DG tumors and normal pituitary. (a) Perp transcript levels are significantly repressed in SG tumors compared with DG or normal pituitary samples. *P < 0.001. (b) Downregulation of PERP was confirmed at the mRNA level by qPCR. *P < 0.001. (c) Low PERP protein levels in SG tumors are also seen by immunoblot. (d) Perp is low in GH3 rat pituitary cell model compared with rat liver control by qPCR.

