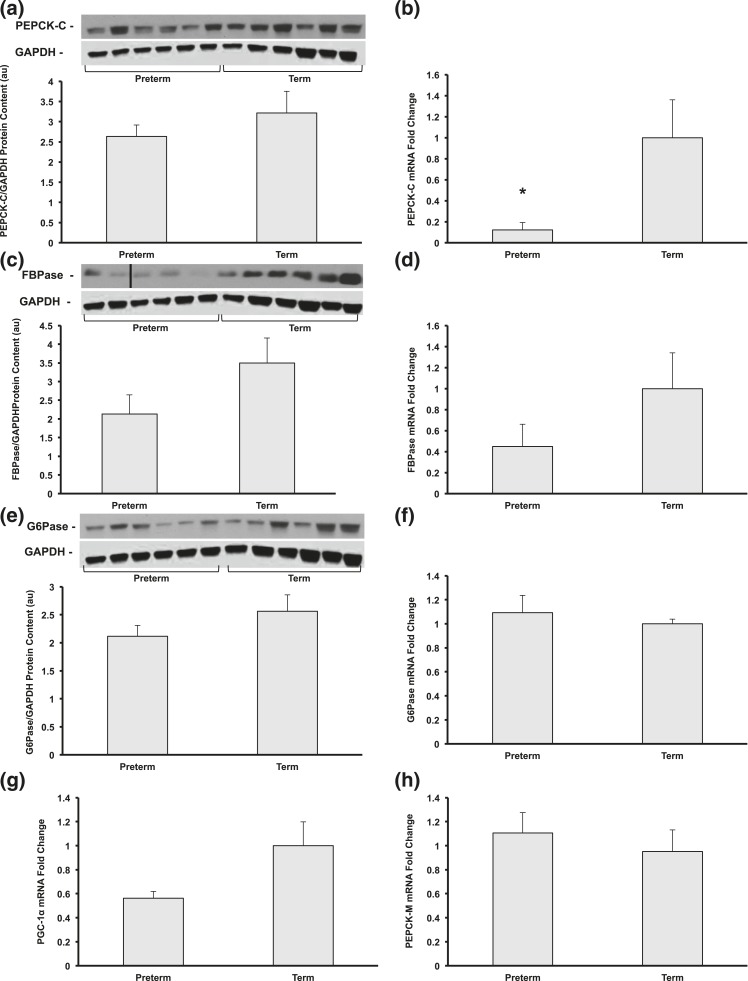
Figure 3.
(a and b) Protein content and gene expression of PEPCK-C, (c and d) FBPase, and (e and f) and G6Pase and (g) gene expression of gluconeogenic coactivator PGC-1α and (h) gluconeogenic enzyme PEPCK-M were measured by Western blot and quantitative reverse transcription-PCR (n = 5 to 6 per group, *P < 0.05). Representative blots from each group are shown. All data shown as mean ± standard error of the mean.

