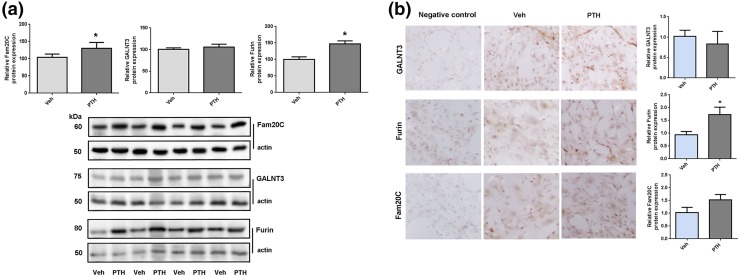
Figure 6.
Protein levels in calvarial osteocyte-like cells. (a) Shows Western blot analysis of Fam20C, GALNT3, and furin protein levels in calvarial osteocyte-like cells 2 hours after PTH or vehicle treatment. The top part shows expression levels normalized to actin using Image J, and the lower part shows the Western blot data. (b) Shows immunohistochemical staining of differentiated calvarial osteocyte-like cells after 21 days in culture treated with PTH or vehicle. The staining is normalized to vehicle. GALNT3, Furin, or Fam20c protein levels are shown. Magnification is 40-fold. *P < 0.05.

