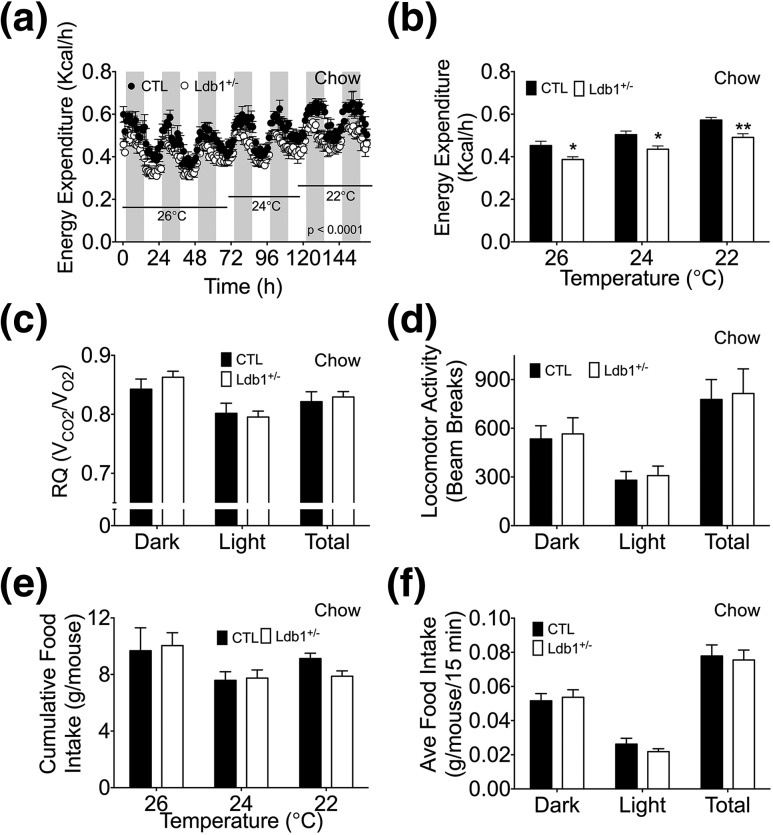
Figure 4.
Indirect calorimetry analysis of Ldb1+/− and control (CTL) littermates. (a, b) EE (kcal/h) at 26°C, 24°C, and 22°C in chow-fed mice. (c) Diurnal patterns of substrate utilization [RQ (VCO2/VO2)] at 26°C. (d) Locomotor activity (counts) at 26°C. (e) Cumulative food intake (g/mouse) at 26°C, 24°C, and 22°C. (f) Diurnal patterns of average food intake (g/mouse/15 min) at 26°C. Data represented as mean ± SEM. *P < 0.05; **P < 0.01; n = 5 mice/group.

