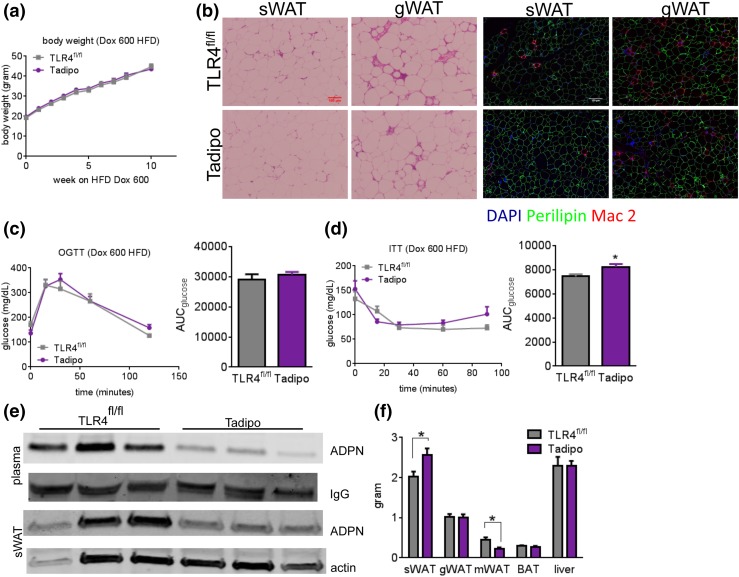
Figure 2.
Tadipo mice display decreased WAT macrophage infiltration, a slight decrease in insulin sensitivity, and decreased systemic adiponectin levels. (a) Ten-week BW follow-up during HFD challenge (n = 10 to 15). (b) H&E staining of sWAT and gWAT after chronic HFD (left). Mac-2 (red) immunostain of sWAT and gWAT (right). Scale bars = 100 μm (left), 110 μm (right). (c) OGTT (2.5 mg/g BW). (d) ITT (0.75 mU/g BW) (n = 6 to 8). (e) Western blot of adiponectin in plasma and the sWAT isolated from Tadipo and control animals after 8 weeks of HFD challenge. Relative intensity is normalized to either IgG or actin signal. (f) Tissue weight after HFD challenge. *P < 0.05 compared with TLR4fl/fl. Data are presented as means ± SEM. AUC, area under the curve.

