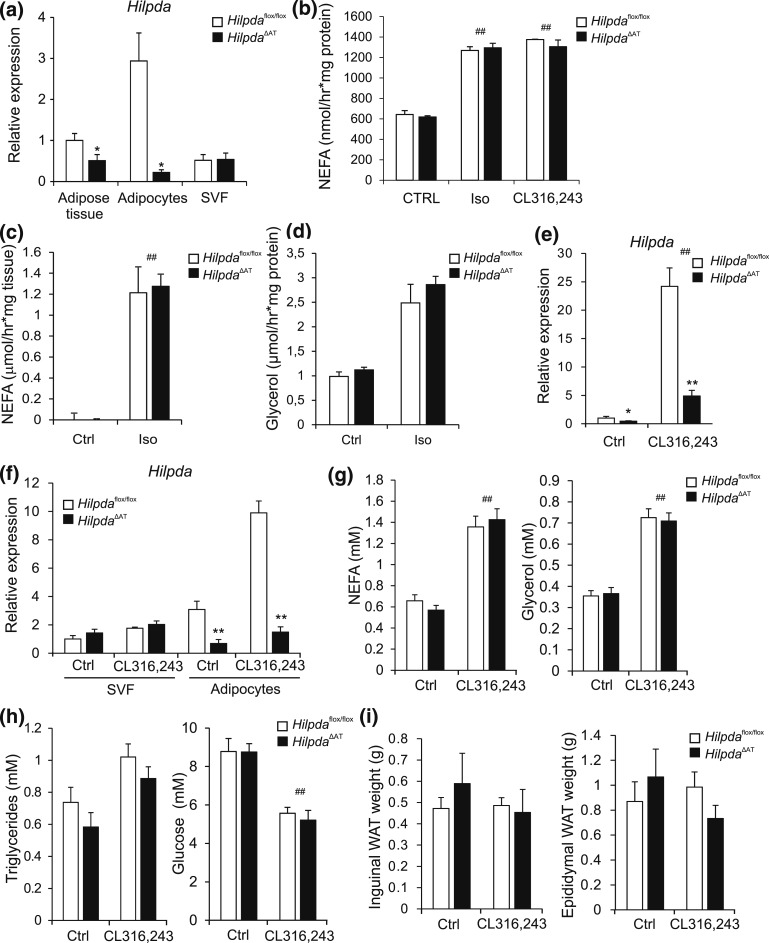
Figure 9.
Adipocyte-specific inactivation of Hilpda has no effect on indicators of lipolysis in mice injected with CL316,243. (a) Hilpda mRNA levels in whole gonadal adipose tissue, and in freshly separated adipocytes and SVF of Hilpdaflox/flox (n = 4) and HilpdaΔAT mice (n = 4). Gene expression levels of Hilpda in adipose tissue from Hilpdaflox/flox mice were set at one. (b) NEFA release in medium of primary adipocytes differentiated from the SVF of iWAT from HilpdaΔAT mice (n = 3) and Hilpdaflox/flox mice (n = 3), serum starved for 2 hours, and incubated with 10 µM isoproterenol or 10 µM CL316,243 for 3 hours. (c) NEFA and (d) glycerol release in medium of WAT explants of HilpdaΔAT mice (n = 3) and Hilpdaflox/flox mice (n = 3), serum starved for 30 min, and incubated with 10 µM isoproterenol for 3 hours. (e) Hilpda mRNA levels in eWAT of Hilpdaflox/flox (n = 8/treatment) and HilpdaΔAT (n = 8/treatment) mice excised and snap frozen 3 hours after subcutaneous injection with 1 mg/kg CL316,243 or saline control. Gene expression levels of saline-treated Hilpdaflox/flox mice were set at one. (f) Hilpda mRNA levels in freshly isolated adipocytes or SVF isolated from eWAT of Hilpdaflox/flox (n = 8/treatment) and HilpdaΔAT mice (n = 8/treatment) 3 hours after subcutaneous injection with 1 mg/kg CL316,243 or saline control. Gene expression levels of the SVF of saline-treated Hilpdaflox/flox mice were set at one. Plasma levels of (g) NEFA and glycerol and (h) triglycerides and glucose of Hilpdaflox/flox (n = 8/treatment) and HilpdaΔAT (n = 8/treatment) mice 3 hours after subcutaneous injection with 1 mg/kg CL316,243 or saline control. (i) Tissue weights of iWAT and eWAT of Hilpdaflox/flox mice (n = 8/treatment) and HilpdaΔAT mice (n = 8/treatment) 3 hours after subcutaneous injection with 1 mg/kg CL316,243 or saline control. Data are mean ± standard error of the mean. (a and e) Asterisks indicate significant differences according to Student t test (*) relative to adipose tissue or SVF of saline-treated Hilpdaflox/flox mice. Asterisks or hashtags indicate significant differences according to two-way analysis of variance (#), followed by Tukey’s honest significant difference post hoc test (*) relative to (b and c) control-treated adipocytes or (d–h) saline-treated mice (#) and relative to (d and f–h) Hilpdaflox/flox mice (*); ** or ##P < 0.01; *P < 0.05. Ctrl, control; Iso, isoproterenol.

