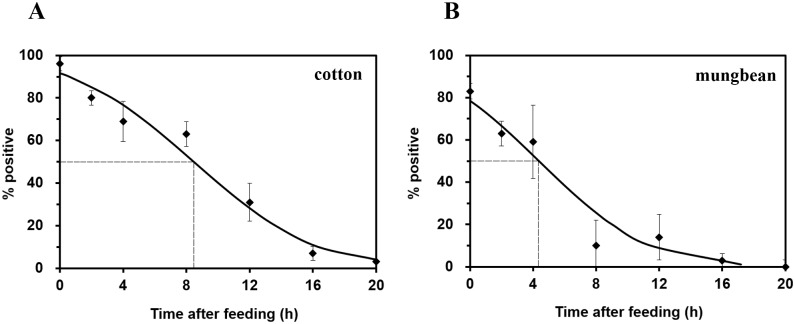
Fig 1. Detection of cotton (A) and mungbean (B) DNA in the guts of A. lucorum adults at different times after ingestion.
Error bars at each point on the curves represent the standard error of three replicates. The model for the relationship between ingestion time (x) and % positive (y) was y = 100%×e(2.27–0.26x)/(1+e(2.27–0.26x)), F = 251.18, df = 2,5, P<0.0001, (A) and y = 100%×e(1.53–0.37x)/(1+e(1.53–0.37x)), F = 139.22, df = 2,5, P<0.0001 (B).

