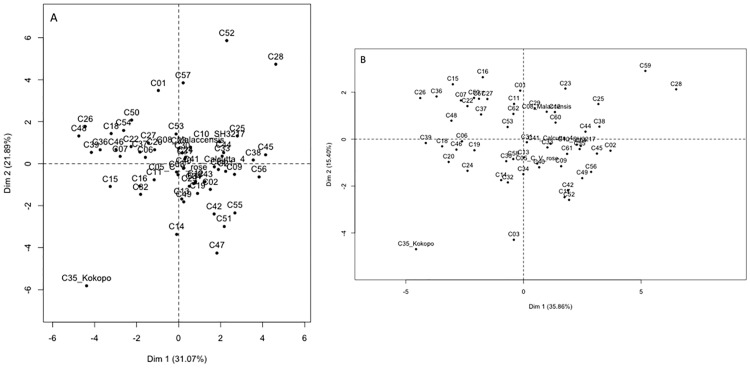
Fig 3. Principal component analysis plots generated in R using package FactoMineR for the cross combinations in a banana genomic selection training population.
(A) shows the distribution of cross combinations under low input field management (GS1) and (B) shows the distribution of cross combinations under high input field management (GS2) on the first two components.

