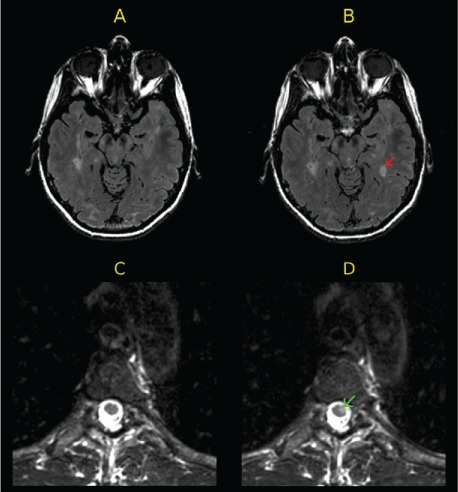
Figure 1.

Examples of active magnetic resonance images (MRIs) at follow-up
A and B, Baseline (A) and 1-year (B) axial fluid-attenuated inversion recovery (FLAIR) brain MRIs of a patient. The follow-up FLAIR MRI (B) shows a new T2 hyperintense brain lesion (red arrow) compared with baseline. C and D, Baseline (C) and 1-year (D) axial T2-weighted fast spin echo (FSE) thoracic spinal cord MRIs of another patient. The follow-up T2-weighted FSE MRI (D) shows a new T2 hyperintense lesion in the thoracic spinal cord (green arrow) compared with baseline.
