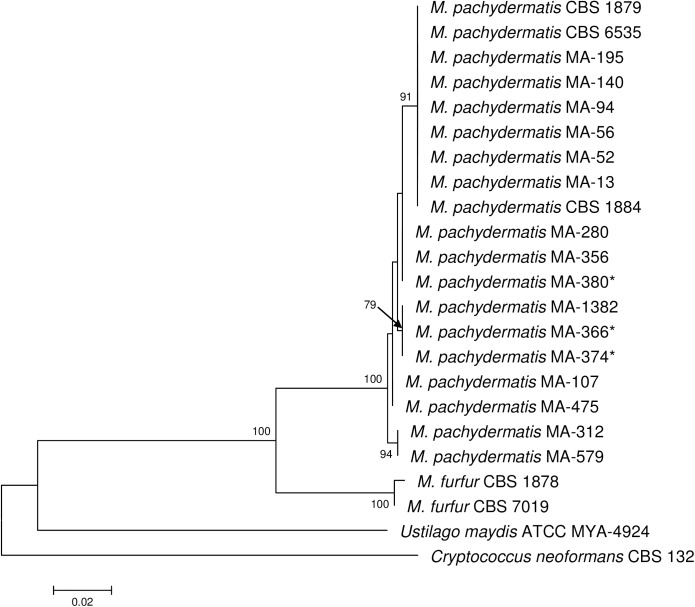
Fig 3. Molecular phylogenetic tree inferred from maximum likelihood analysis of LSU sequences of Malassezia pachydermatis strains.
Bootstrap values > 70% in 1,000 replications are shown at the nodes. Sequences of M. furfur CBS 1878 and CBS 7019, Ustilago maydis ATCC MYA-4924 and Cryptococcus neoformans CBS 132 as outgroup were selected for the tree construction.* Lipid-dependent strains.

