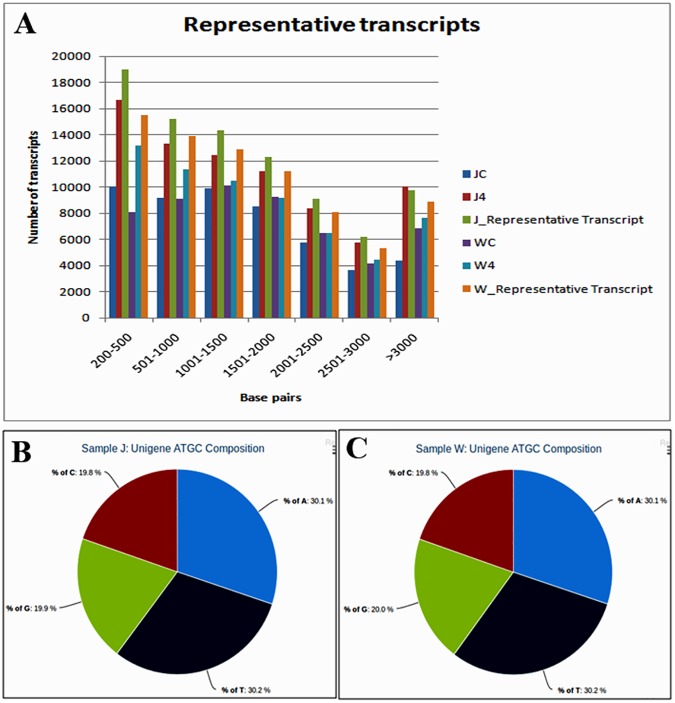
Fig 2. Graphical presentation of representative transcripts of susceptible (JG62) and resistant (WR315) chickpea and their ATGC distribution.
A. Graph represents the base pair distribution of transcripts of JG62 (J4 and JC) and WR315 (W 4 and WC) with their representative transcripts. Pie chart represents unigene ATGC cluster of samples B. susceptible (JG62) and C. resistant (WR315) chickpea genotypes respectively.

