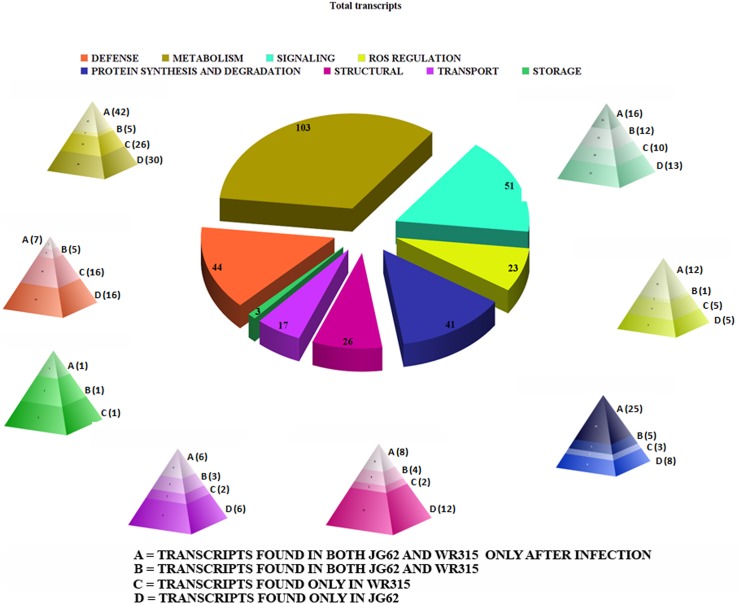
Fig 6. Functional clustering of total transcript with fragmented pie chart using Chart Tool software package.
Individual pie fragments are distributed into gene pyramids having four zones. A. represents transcripts found in both JG62 and WR315 only after infection; B. represents transcripts found in both uninduced JG62 and WR315, C. represents transcripts found only in WR315 after infection and D. represents transcripts found only in JG62 after infection.

