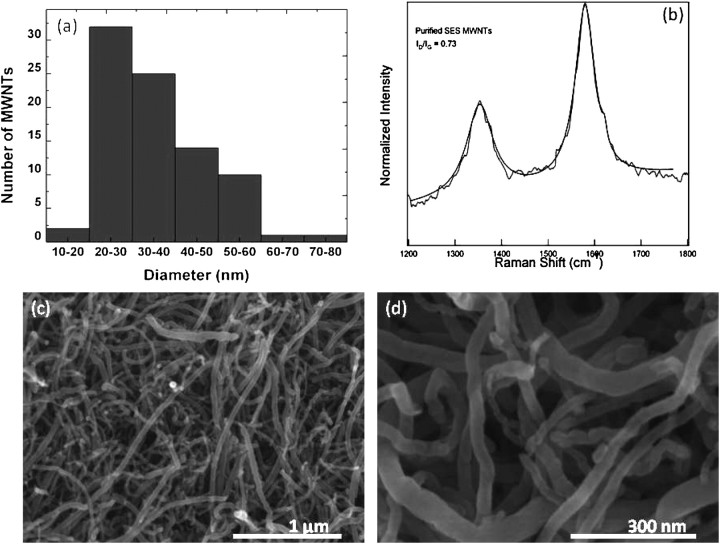
Figure 1.
(a) Diameter distribution of multiwall carbon nanotubes (MWCNTs) obtained from scanning electron microscopy images in c and d. (b) Raman spectrum of MWNTs reveals presence of a D peak (∼1,350 cm−1), G peak (∼1,580 cm−1), and D′ peak (1,620 cm−1). (c and d) Typical scanning electron microscopy images of MWCNTs.

