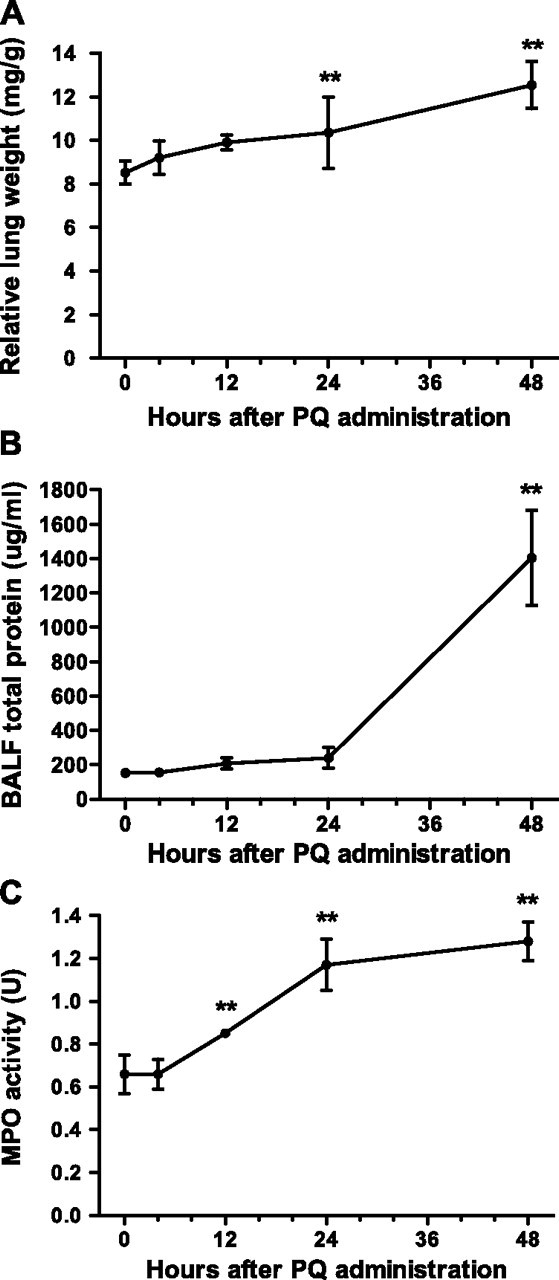
Figure 2.

Time-dependent progression of ALI after PQ poisoning. ALI was assessed at different times after PQ20 treatment by lung index (A), BALF total protein (B), and MPO activity (C). *P < 0.05 or **P < 0.01, relative to the corresponding 0-hour group. Data presented are means (±SD); n = 8 per group.
