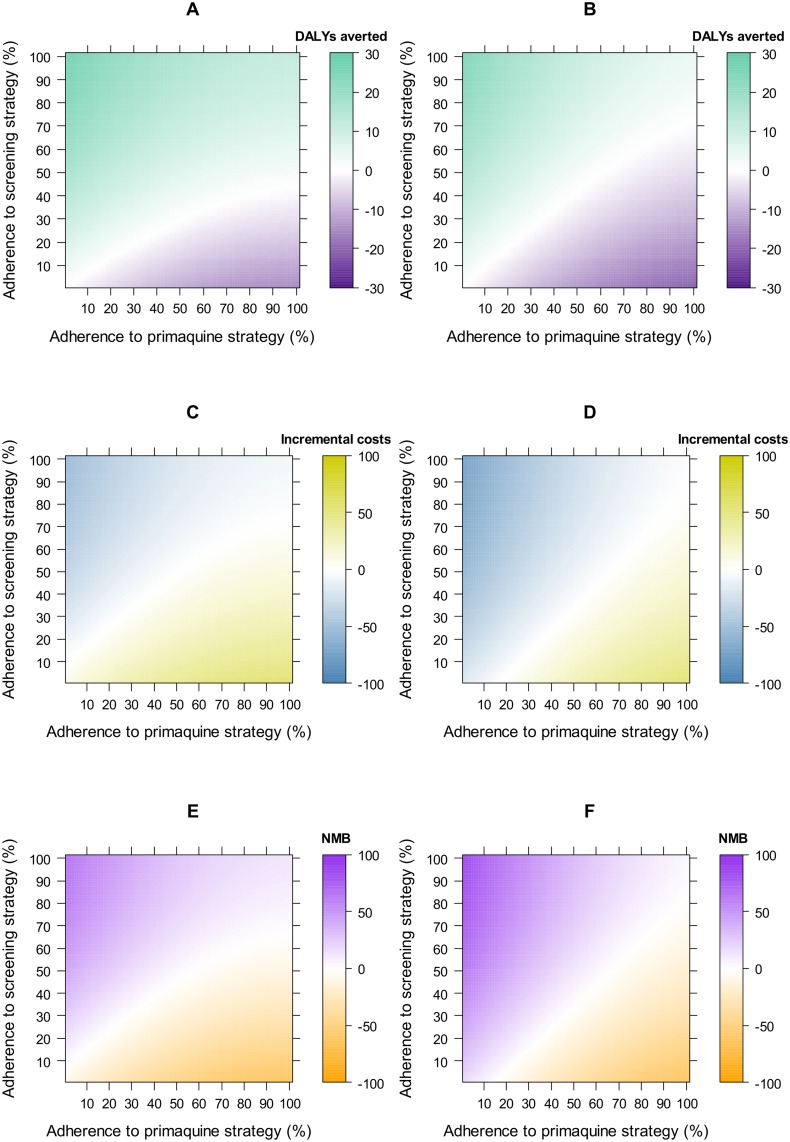
Fig 6. Two-way sensitivity analysis results showing the impact of changes in the level of adherence to primaquine regimens.
Green represents disability-adjusted life-years (DALYs) averted by the screening strategy for a cohort of 1000 individuals. For costs, yellow indicates increased costs and blue indicates cost savings for the screening strategy for one individual. For net monetary benefit (NMB), purple indicates scenarios where the screening strategy would be cost-effective at a threshold of US$500 (T) where NMB = T × ΔDALYs– ΔCosts.

