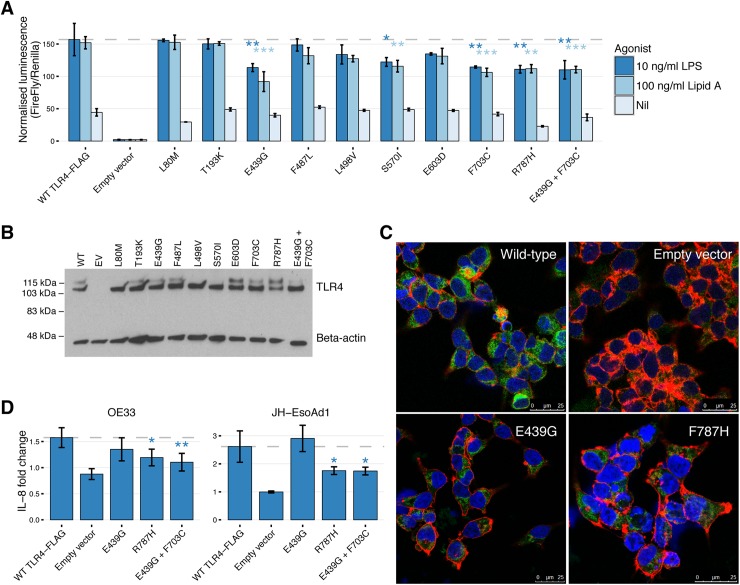
Fig 3. Functional analysis of TLR4 mutations.
(A) NF-κB response to TLR4 ligands in HEK293 cells transfected with TLR4 mutants versus wild-type TLR4 and stimulated with 100 ng/ml synthetic Lipid A and 10ng/ml LPS. The y-axis is normalized luminescence, calculated by dividing NF-κB firefly luciferase by the housekeeper renilla luciferase. Results are the average of three experiments with all conditions performed in triplicate. Error bars are standard deviation. *p<0.05, **p<0.01, ***p<0.001. (B) TLR4 protein expression 48 hours after transfection for NF-κB luciferase reporter assays. Representative Western blot shows protein expression for nine TLR4 mutants, the double mutant (E439G + F703C), wild-type TLR4 and empty vector. Fully glycosylated TLR4 is the upper band (120 kDa), and deglycosylated TLR4 is the lower band (110 kDa). (C) Immunofluorescence staining FLAG-AlexaFluor 488 antibody (green) in HEK293 cells transfected with wild-type TLR4-FLAG shows cytoplasmic distribution, in comparison to empty vector. Mutant E439G and R787H did not show any difference in localization of TLR4 protein. DAPI (blue) and Phalloidin (red) were used to visualize the cell nucleus and cytoskeleton, respectively. (D) Fold-change secretion of IL-8 for the EAC cell lines OE33 and JH-EsoAd1 following transfection of TLR4 mutants E439G, R787H, E439G+F703C and wild type TLR4. Cells were stimulated with synthetic MPLA and LPS for 24 hours prior to ELISA. Data were normalized by dividing the concentration of IL-8 by the unstimulated (nil) value for each transfection condition. Data are an average of four independent experiments performed in duplicate. Error bars are standard deviation. *p<0.05, **p<0.01,

