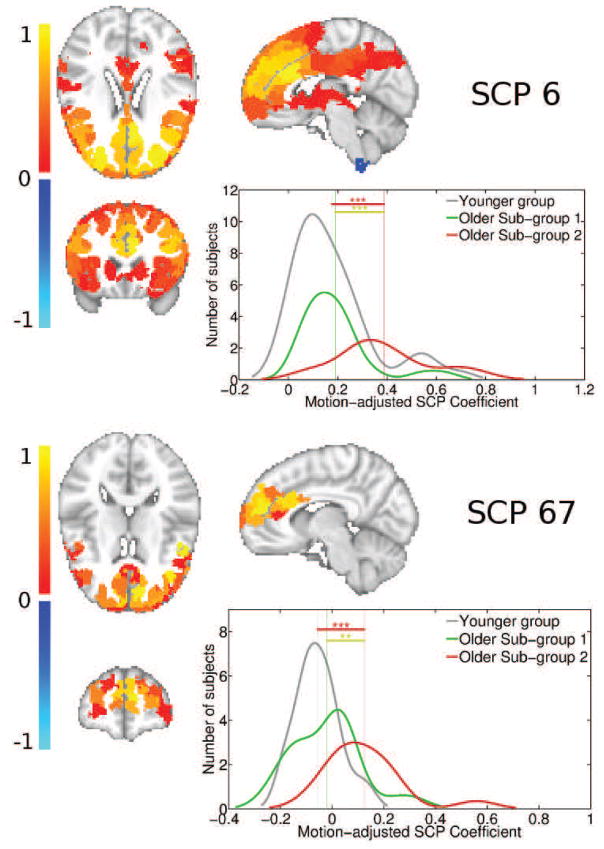
Figure 13.
Plot showing primary SCP 6, and its associated secondary SCP 67, whose average connectivity is increased in the second older subgroup, but not the first. SCP 2 highlights most of the pre-frontal cortex. SCP 67 captures the bilateral para-cingulate gyrus and inferior temporal gyrus. The distribution fit of the underlying SCP coefficient histograms are also shown, for each SCP and for each subgroup. Significance levels is indicates as follows: ’***’ for p-value < 0.001, ’**’ for p-value < 0.01 and ’*’ for p-value < 0.05.

