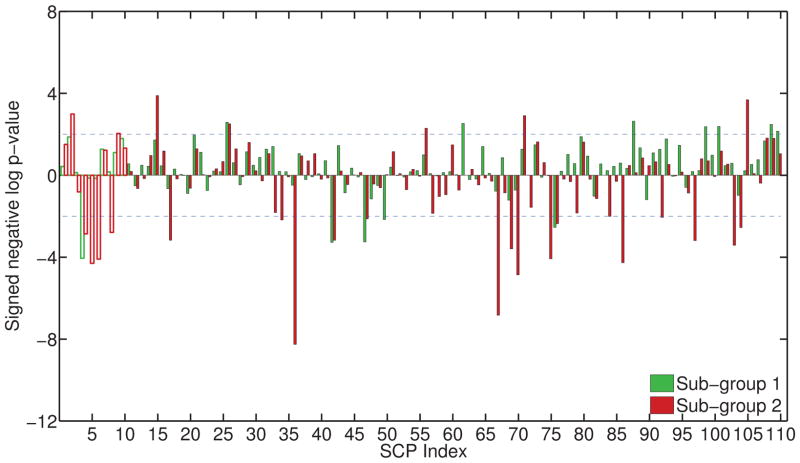
Figure 9.
Plot showing the result of uni-variate comparison of SCP coefficients between younger subjects and the two older subject groups. The y-axis measures the signed negative log p-value: −log10(p) * sign(t), where t: t-statistic and p: p-value. Decreased connectivity results in a positive value, increased connectivity in a negative value. Comparison of young vs. SG1 is shown in green, young vs. SG2 is shown in red. The p-values for primary SCPs are shown as an outline.

