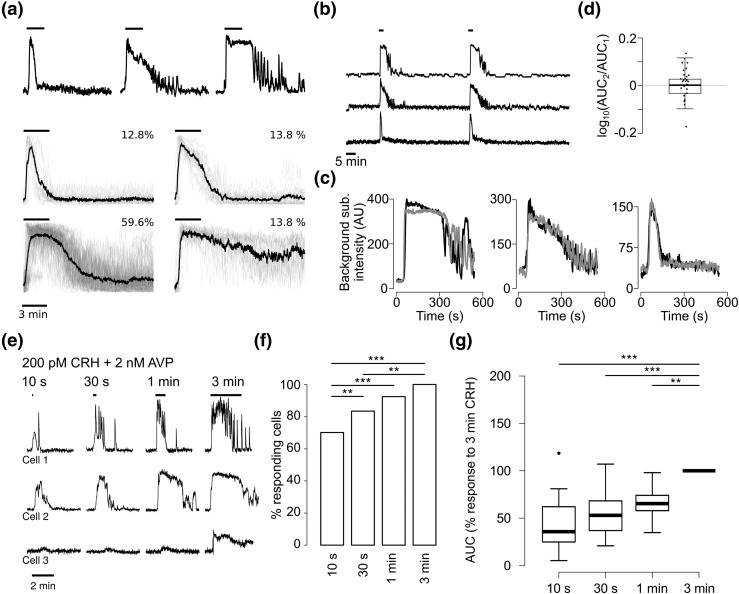
Figure 2.
(a) Top: Example of three corticotrophs treated simultaneously with 200 pM CRH and 2 nM AVP for 3 minutes (indicated by black bar), showing large heterogeneity in the calcium response to the stimulus. Bottom: Responses to 3-minute CRH plus AVP stimuli in the corticotroph population, classified depending on their [Ca2+]i response (n = 94 cells from 10 experiments; black line shows mean response, gray lines show individual traces; black bars indicate period of exposure to CRH plus AVP). In all of the panels, traces are shown as normalized between 0 and 1, and the y-axis is omitted for visual clarity. (b) Responses of the three corticotrophs in (a) to two successive applications of CRH plus AVP. Black bars indicate time of exposure to CRH plus AVP. (c) Superposition of extracts of the two traces shown in (b), showing deterministic [Ca2+]i changes in corticotrophs after secretagogue stimulation. Black line shows response to the first challenge (starting at 15 minutes); gray line shows response to the second challenge (starting at 45 minutes). (d) Box plot showing the log-transformed ratio of the AUC of the Ca2+ response to two exposures to CRH plus AVP. The log ratio is not different from 0 (n = 26 cells from three experiments, P = 0.86, one-sample t test). (e) Examples of three corticotrophs stimulated with 200 pM CRH plus 2 nM AVP for increasing amounts of time, showing heterogeneity in the minimum amount of exposure required to have a response. Black bars indicate time of exposure to CRH plus AVP. (f) Cumulative percentage of cells responding to the protocol shown in (e). **P < 0.001, ***P < 0.0001, logit model, Tukey post hoc test. (g) Box plot of AUC of the cells, expressed as percentage of the longest treatment of the experiment shown in (e) (n = 32 cells from four experiments). **P < 0.01, ***P < 0.001, mixed effects model.

