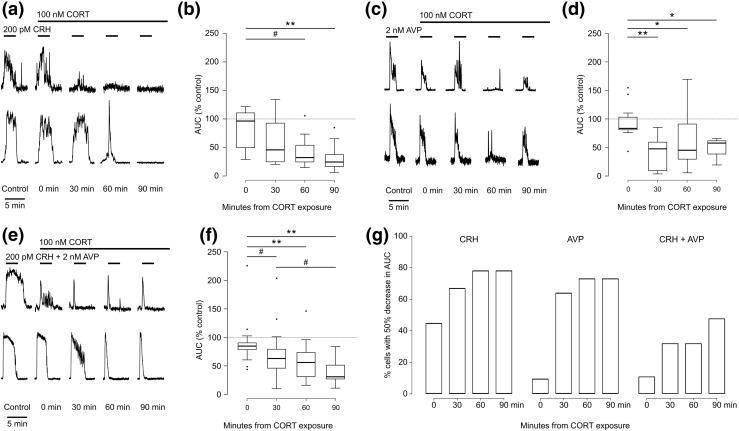
Figure 5.
(a) Example of calcium responses from two corticotrophs treated with 200 pM CRH for 3 minutes and then repeatedly challenged with the same stimulus at 30-minute intervals in the presence of 100 nM corticosterone. The lines above the trace show the timing of the exposure. (b) Box plot of AUC for the responses from the experiment shown in (a), expressed as percentage of control exposure (n = 9 cells from three experiments). #P < 0.05, **P < 0.001. All groups except the “0 minutes” group are different from control (P < 0.01, mixed effects model). (c and d) As in (a) and (b), but for exposure to 2 nM AVP (n = 9 cells from four experiments). *P < 0.01, **P < 0.001, mixed effects model. All groups but the “0 minutes” group are different from control (P < 0.01, mixed effects model). (e and f) As in (a) and (b), but for exposure to 200 pM CRH plus 2 nM AVP (n = 12 cells). #P < 0.05, **P < 0.001, mixed effects model. All groups except the “0 minutes” group are different from control (P < 0.001, mixed effects model). (g) Bar plot showing the cumulative percentage of cells with a 50% decrease in the AUC over time. The 30- and 60-minute groups are different from 0 (P < 0.05), and the 90-minute group is different from 0 (P < 0.001, logit model, Tukey post hoc test). Treatment with CRH and treatment with AVP are significantly different from treatment with CRH plus AVP (P = 0.03, logit model).

