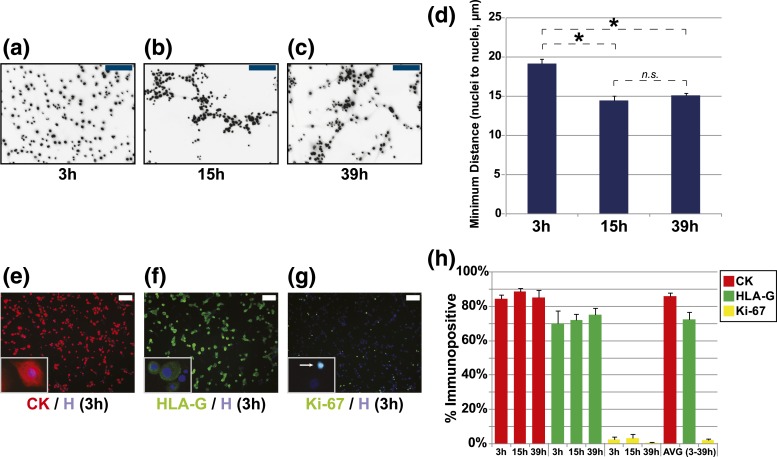
Figure 2.
Morphological transitions of cultured primary human CTBs over 39 hours. (a–c) CTBs were incubated for 3, 15, and 39 hours before the nuclei were visualized by Hoechst staining. (d) The average minimum distance among CTB nuclei (n = 3). Asterisks signify P ≤ 0.05 (t test). Representative images of immunostaining for (e) CK, (f) HLA-G, and (g) Ki-67 in CTBs at 3 hours; nuclei were stained with Hoechst. (h) Average percentage of cells that stained for these antigens as a function of time in culture. Images are representative of ≥3 independent experiments. Scale bars = 100 µm. n.s., not significant.

