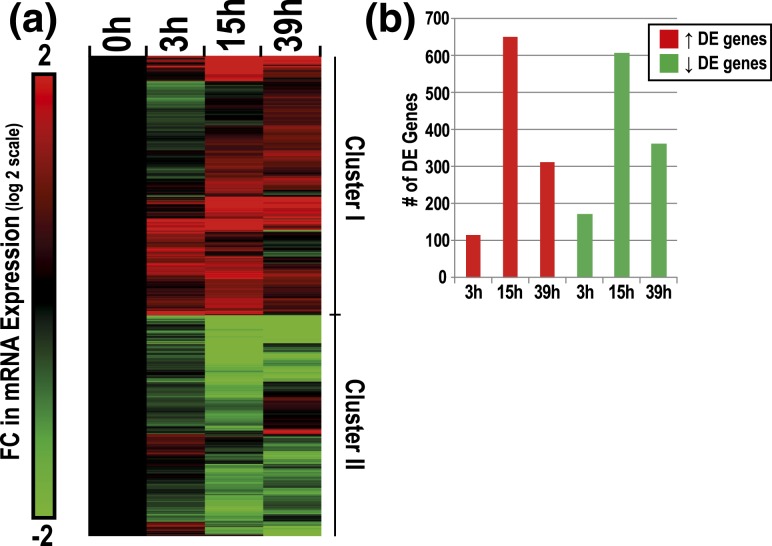
Figure 3.
Characterization of changes in CTB gene expression as a function of time in culture. (a) Hierarchical clustering of time-dependent DE genes in CTBs (2232 genes total, P ≤ 0.00005, absolute FC ≥ 2). Upregulated or downregulated genes over time in culture were designated as either cluster I or cluster II, respectively. Average FC values are displayed as the ratio of average intensities between each time point and the average 0-hour CTB values (log 2 scale). (b) Post hoc t test analysis of DE genes per time point (t test, P ≤ 0.001, absolute FC ≥ 2).

