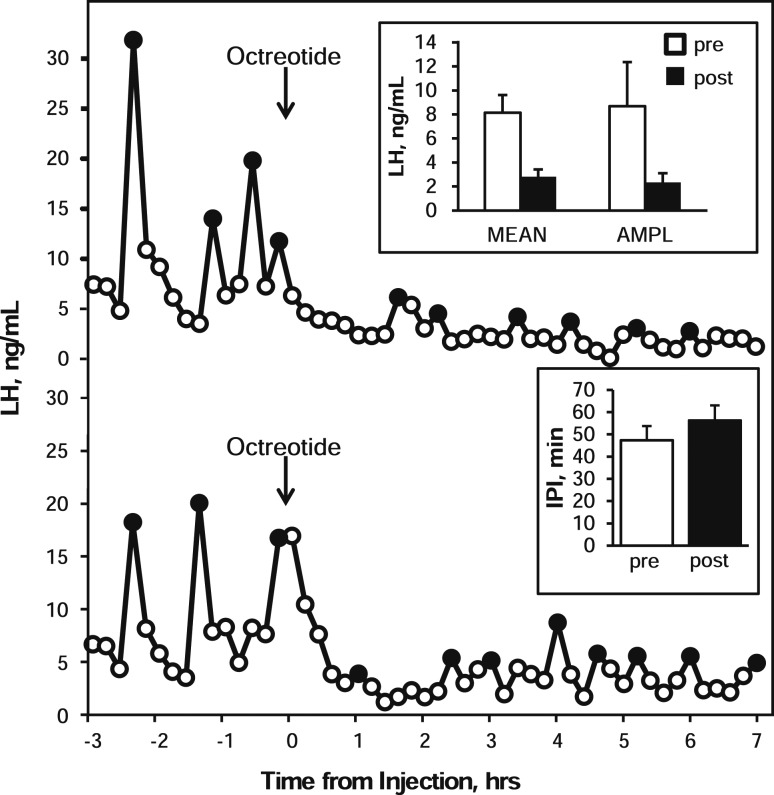
Figure 1.
LH concentration patterns in two ewes receiving injections of the SSTR2 agonist octreotide (arrows) into the third ventricle. Black circles denote samples identified as pulses. Inset panels depict group mean [± standard error of the mean (SEM)] LH concentration (MEAN), LH pulse amplitude (AMPL), and interpulse interval (IPI) during the 3-hour preinjection (open bars) and 7-hour postinjection (black bars) periods. Statistical analysis was not performed because of the low number of animals (n = 3) and the lack of contemporary vehicle control injection.

