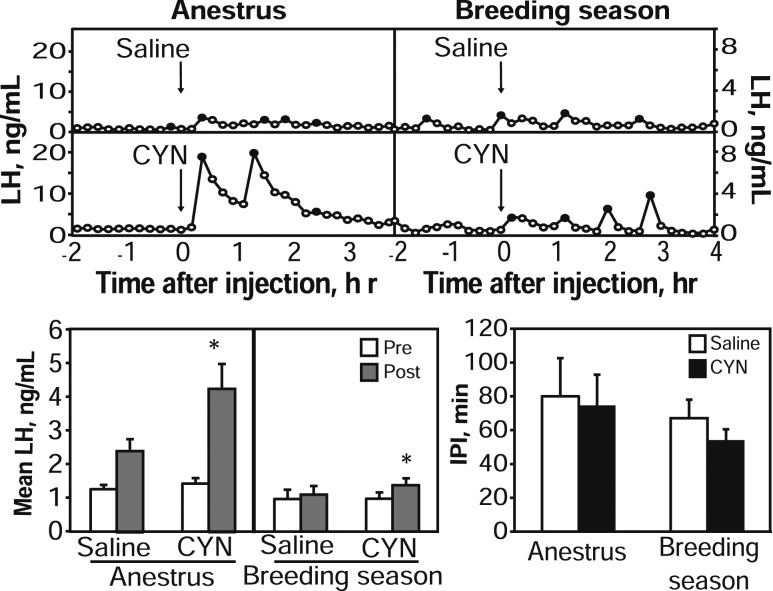
Figure 3.
Top: Representative LH concentration patterns in one anestrous intact ewe (left) and another luteal phase ewe (right) receiving saline (top panels) or CYN (bottom panels) as ICV injection (arrows). Black points represent samples identified as pulses. Note differences in y-axes between seasons. Bottom panels: Mean LH (± SEM) concentrations during the 2 hour preinjection (open bars) and 4 hour postinjection (gray bars) sampling periods for saline or CYN treatments are shown on the left, and mean IPI (± SEM) values during the 4-hour sampling period after saline (open bars) or CYN (black bars) are shown on the right. *P < 0.05 versus preinjection period.

