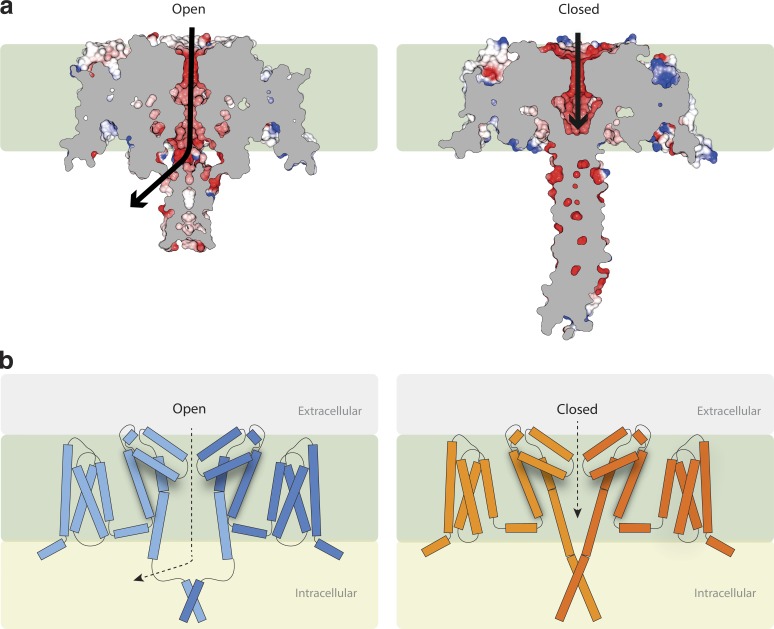
Figure 5.
Gating and ion translocation. (a) Lateral (transmembrane) slice through the centers of the NavMs (left) and CavAb (right) structures. Slabs through the space-filling models show the pathway (black arrows) for ion egress in the open NavMs structure via the opening at the side of the CTD adjacent to the end of the intramembrane pore region and the blockage at the end of the CavAb structure, ending before the end of the transmembrane pore region, which prevents ions exiting the pore. (In both parts a and b of this figure, the hydrophobic region of the membrane is represented by the green background.) (b) New model for channel gating (a modification to the earlier Bagnéris et al. [2013] and Shaya et al. [2014] models), now depicting schematically the role of the IM in stabilizing the open conformation formed by the splayed bottoms of the S6 helices. Left: The activated (open) state. Right: The resting (closed) state. For simplicity, only two subunits are shown for each structure. The tubes represent helical structures, and the connecting lines are segments that are not helical. The distal ends of the CTDs in both cases act to stabilize the tetrameric structures.

