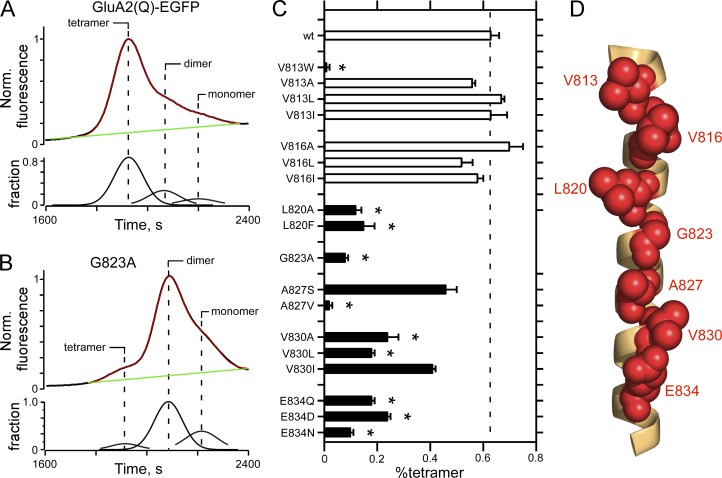
Figure 2.
FSEC to assay AMPAR oligomerization. (A and B) Raw FSEC chromatographs of wild-type GluA2(Q)-EGFP (A) or the same construct containing an alanine substitution at G823 (GluA2(Q)(G823A); B). For quantification, we normalized all chromatographs to the tetramer peak in the wild type for that transfection cycle. For the top panel in each plot, the black line is the original data, the green line the baseline, and the red line is the sum of the individual fits derived from a multi-peak fitting routine (see Materials and methods); the bottom panels show the fraction of the total chromatograph corresponding to, from left to right, tetramer, dimer, or monomer. (C) Mean (±SEM) of the %tetramer (see Materials and methods) for various substitutions of VVLGAVE face positions of the M4 segment in GluA2(Q). Black bars indicate values significantly different from wild type (P < 0.05, ANOVA); asterisks indicate values significantly different from subtle mutations at V813 and V816. Number of independent FSEC runs: wt, 16; V813W, 3; V813A, 4; V813L, 4; V813I, 3; V816A, 4; V816L, 3; V816I, 4; L820A, 4; L820F, 6; G823A, 5; A827S, 3; A827V, 4; V830A, 3; V830L, 3; V830I, 3; E834Q, 6; E834D, 7; E834N, 3. (D) GluA2 M4 segment with VVLGAVE positions shown in red space–filled balls.

