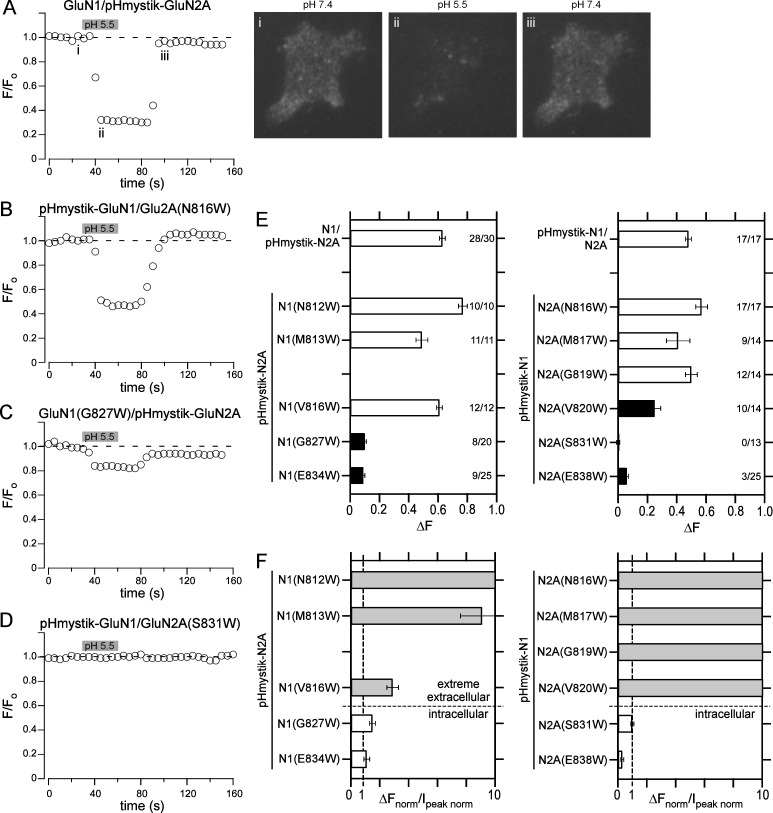
Figure 4.
Assaying surface expression of NMDARs using pHmystik, a pH-sensitive GFP. (A–D) Fluorescence time trace of GFP intensity as the extracellular bath solution pH was changed from 7.4 to 5.5 (gray bar, 30-s duration) and back again. Shown are HEK293T cells expressing GluN1/pHmystick-GluN2A (A), pHmystik-GluN1/GluN2A(N816W) (B), GluN1(G827)/pHmystick-GluN2A (C), or pHmystik-GluN1/GluN2A(S831W) (D). The representative cell images are from the time-points labeled in panel A; the images were taken at the approximate time points when the baseline fluorescence (Fo), corresponding to image (i), and the test fluorescence (Ftest), corresponding to image (ii), were measured as well as an image (iii) after return to pH 7.4. The change in fluorescence (ΔF = Fo − Ftest) was used as an index of surface expression. Sampling rate, 5 s. (E) Changes in cell fluorescence (±SEM) at low pH (ΔF, see Materials and methods) for positions in either GluN1 (left) or GluN2A (right). Solid bars indicate values significantly different from their respective wild type either N1/pHmystik-N2A (left) or pHmystik-N1/N2A (right; P < 0.05, t test). The numbers (far right in each plot) indicate the number of cells that showed detectable changes in surface expression relative to the total number of cells tested (see Materials and methods). Only cells that showed detectable changes in fluorescence were included in statistical analysis. (F) Relationship between surface expression, assayed by changes in fluorescence, and whole-cell current amplitudes. For comparison, values (±SEM) are normalized to their respective wild type, either for surface expression (ΔFnorm) or for peak whole-cell current amplitudes (Ipeak norm; Fig. 3 B). For this ratio of normalized values, a number close to unity implies a correlation between the two parameters, whereas a number much greater than unity indicates surface expression is much greater than expected from whole-cell currents.

