Figure 2.
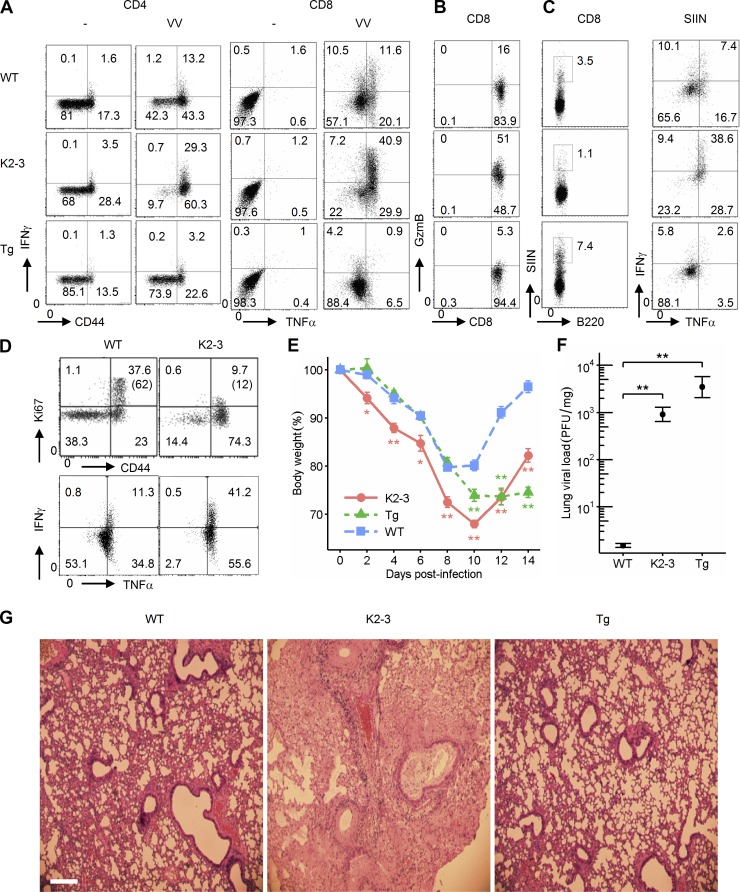
Egr2 and 3 control differentiation of effector T cells. WT, CD2-Egr2/3−/− (K2-3), and CD2-Egr2 transgenic (Tg) mice were infected with OVA-VVWR i.n. and analyzed 7 d after infection. (A) CD4 and CD8 cells from spleen and lymph nodes of uninfected and infected mice were incubated with virus-infected LB27.4 cells for 16 h before analysis of IFNγ- and TNF-producing cells. (B) Granzyme B–producing CD8 cells from spleen and lymph nodes of infected mice were analyzed after in vitro stimulation as in A. (C) CD8 cells were isolated from spleens of infected mice and incubated with virus-infected LB27.4 cells for 16 h in vitro. CD8+Kb-SIINFEKL-tetramer+ cells (left) were analyzed for IFNγ and TNF production (right). (D) CD8 T cells among lung-infiltrating lymphocytes from infected mice were gated for analysis of proliferation and production of cytokines. The percentages of Ki67+ cells among the CD44high population are indicated in parentheses. (E) Body weight loss of infected mice. (F) Viral titer in lung tissue specimens. (G) H&E staining of lung tissues 7 d after infection. Bar, 100 µm. Data in A–D are from pooled cells from five mice of each genotype and are representative of three independent experiments. Data in E–G are representative of five independent experiments with four to five mice per group. Data in E and F are means ± SEM and were analyzed with Kruskal–Wallis tests, followed by Conover tests with Benjamini–Hochberg correction. *, P < 0.05; **, P < 0.01.

