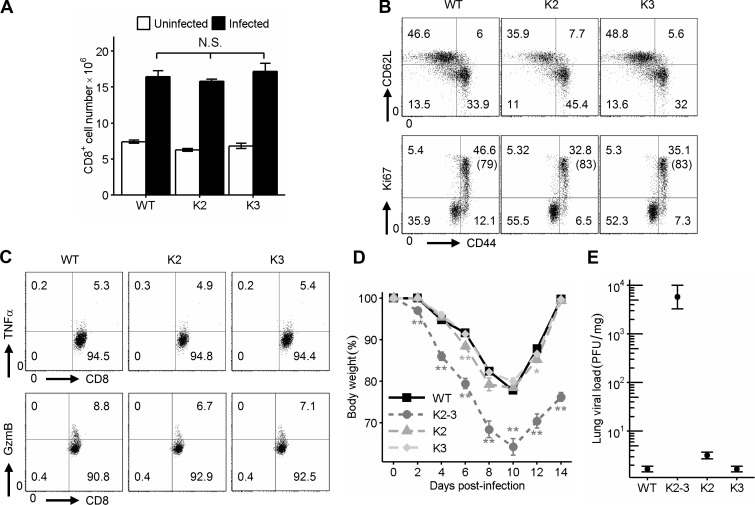
Figure 3.
Overlapping function of Egr2 and 3 in control of T cell proliferation and differentiation. WT, CD2-Egr2 knockout (K2), and Egr3 knockout (K3) mice were infected with OVA-VVWR i.n. for 7 d. (A–C) CD8 T cells from spleen and lymph nodes were analyzed for expansion (A), activation and proliferation (B), and production of cytokines (C). The percentages of Ki67+ cells among the CD44high population are indicated in parentheses in B. (D and E) Body weight loss (D) and lung viral load (E) were measured compared with CD2-Egr2/3−/− (K2-3) mice. A–E are representative of two independent experiments with four mice per group. Data in A, D, and E are means ± SEM and were analyzed with Kruskal–Wallis tests, followed by Conover tests with Benjamini–Hochberg correction. N.S., not significant; *, P < 0.05, **, P < 0.01.

