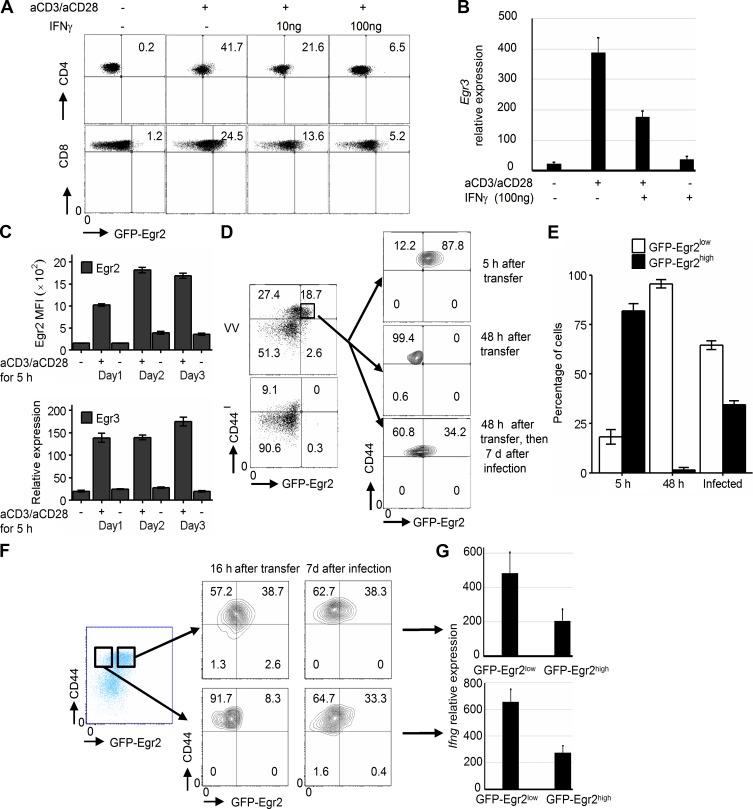
Figure 9.
Egr2 and 3 expression is repeatedly temporally regulated by TCR signaling in activated T cells. (A and B) Naive CD4 and CD8 T cells were stimulated with the indicated stimuli for 16 h before analysis of GFP-Egr2 expression (A) or Egr3 expression by RT-PCR (B). (C) Naive CD4 T cells were repeatedly stimulated with 2 µg/ml anti-CD3 and 2 µg/ml CD28 for 5 h with 19-h intervals over a 3-d period. Egr2 MFI was analyzed by flow cytometry, and Egr3 expression was analyzed by RT-PCR, before and after each interval. (D and E) CD44highGFP-Egr2highCD45.2+ CD8 T cells from GFP-Egr2 knock-in mice 7 d after infection were sorted and adoptively transferred into CD45.1+ WT mice. Recipient mice were infected with OVA-VVWR i.n. 48 h after transfer. Recipients were analyzed for Egr2 expression 5 or 48 h after transfer or 7 d after viral infection, as indicated. (F and G) CD44highGFP-Egr2highCD8+ and CD44highGFP-Egr2lowCD8+ cells were isolated from CD45.2+GFP-Egr2 knock-in mice after infection with OVA-VVWR for 7 d and then adoptively transferred into CD45.1+ WT mice. (F) GFP-Egr2 expression was examined 16 h after transfer or 7 d after OVA-VVWR infection. (G) IFNγ expression by CD44highGFP-Egr2highCD8+ cells and CD44highGFP-Egr2lowCD8+ cells isolated from infected recipient mice was analyzed by RT-PCR. Data in B and G are means ± SD, and data in C and E are means ± SEM. Data in A–C are representative of three independent experiments. Data in D–G are from pooled cells from four to five mice in each group and are representative of three independent experiments.

