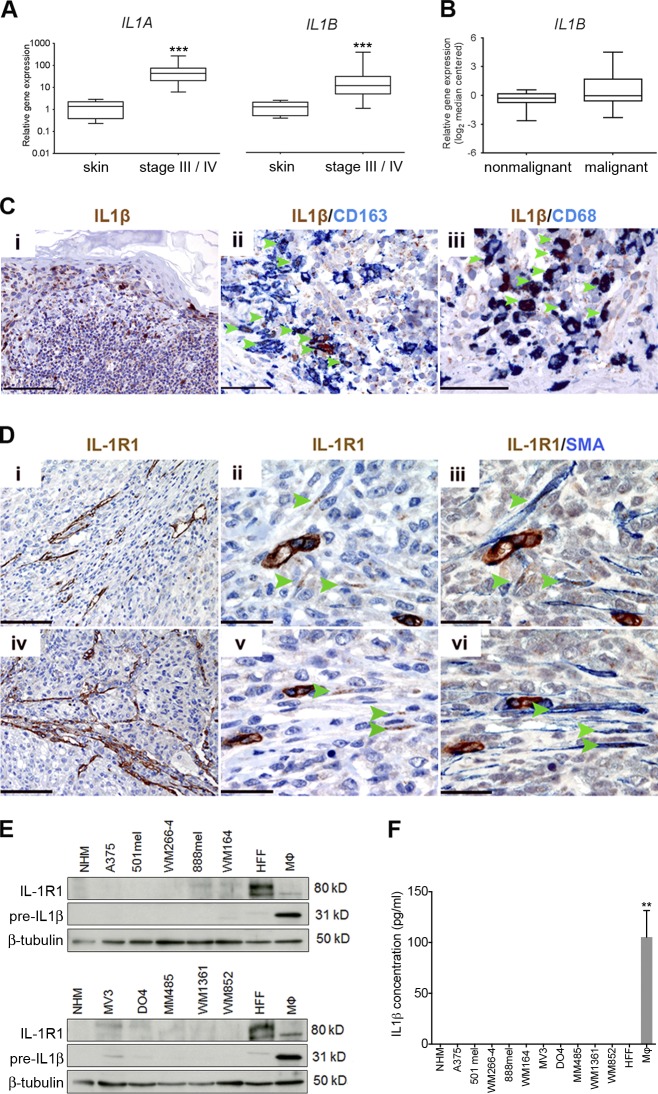
Figure 1.
IL-1 and IL-1R1 expression is enriched in the melanoma stroma. (A) Real-time qPCR analysis of IL1A and IL1B expression in stage-III and stage-IV melanoma tumor samples (n = 39) relative to expression in human skin samples (n = 8). ***, P < 0.001; Mann-Whitney test. (B) Analysis of IL1B expression in normal skin and benign nevi samples (nonmalignant; n = 25) and cutaneous melanoma samples (malignant; n = 45) from an available gene expression dataset (Talantov et al., 2005) accessed through the Oncomine platform. (C) Sections from a case of primary cutaneous melanoma stained for IL-1β, CD163, and CD68 expression as indicated by labels. Bars: (i) 200 µm; (ii) 50 µm; (iii) 33 µm. (D) Serial sections from two skin metastases (i–iii and iv–vi, respectively), stained for IL-1R1 and SMA expression as indicated by the labels. Bars: (i and iv) 200 µm; (ii, iii, v, and vi) 33 µm. (C and D) Arrowheads indicate cells that are clearly double stained. (E) Western blot analysis of IL-1R1 and IL-1β precursor protein expression in a panel of cell lines. Data are representative of three independent experiments. (F) Secreted IL-1β in conditioned media from a panel of melanoma cell lines detected by ELISA. Data are represented as mean ± SEM for three independent samples in each group. **, P < 0.01; Dunn’s multiple comparisons test. (E and F) Macrophages (Mφ) were stimulated with 100 ng/ml IFN-γ and 20 ng/ml LPS.

