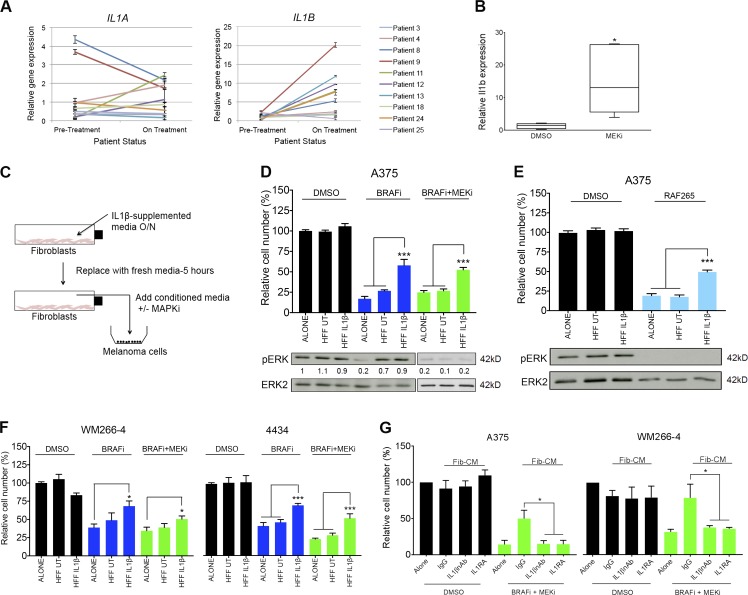
Figure 6.
The IL-1β signaling cascade is augmented by and confers tolerance to MAPK pathway inhibitors. (A) Real-time qPCR analysis of IL1A (left) and IL1B (right) expression in tumors from BRAFV600E-positive metastatic melanoma patients undergoing treatment with BRAFi alone or a BRAFi and MEKi combination (n = 10). Each line represents relative gene expression in an individual patient pretreatment and at 10–14 d on treatment, with error bars representing mean ± SD from three repeats. (B) Real-time qPCR analysis of Il1b expression in BrafV600E-4434 allografts from C57J/B6 mice treated with 25 mg/kg/d PD184352 (MEKi; n = 5) or vehicle (DMSO; n = 5) for 20 d. Unpaired Student’s t test was used. (C) Schematic of in vitro co-culture assay of melanoma cells and fibroblasts using conditioned media from IL-1β–stimulated fibroblasts in combination with MAPK signaling inhibitors (MAPKi). O/N, overnight. (D, top) Growth assay of A375 cells treated with 1% DMSO, 1 µM PLX4032 (BRAFi), or 0.5 µM both PLX4032 and selumetinib (MEKi), cultured in nonconditioned media or conditioned media taken from unstimulated fibroblasts or fibroblasts previously stimulated with IL-1β. UT, untreated. (Bottom) Representative Western blot analysis and quantification of pERK expression in A375 cells treated as just described, for 24 h. (E, top). Growth assay of A375 cells treated with 1% DMSO or 1 µM RAF265 (pan-RAFi), cultured in conditioned media as in D. (Bottom) Representative Western blot analysis of pERK expression in A375 cells treated as just described for 24 h. (D and E) Western blot data are representative of two independent experiments. (F) Growth assay of WM266-4 (left) and 4434 (right) cells treated as in D. (G) Growth assay of A375 (left) and WM266-4 (right) cells treated with 1% DMSO or 0.5 µM both PLX4032 and selumetinib, cultured in nonconditioned media or conditioned media taken from fibroblasts previously cultured in media taken from Mel-CM–treated macrophages supplemented with 1 µg/ml normal goat IgG control, 1 µg/ml IL-1β neutralizing antibody (IL1βnAb), or 1 µg/ml IL-1RA. (D–F) Data are represented as mean ± SEM from at least three independent experiments with a minimum of eight repeats. Tukey’s multiple comparisons test was used. (G) Data are represented as mean ± SEM from at least three independent experiments. Mann-Whitney test was used. For all growth assays, cells were treated for 48 h, and cell number was assayed by crystal violet staining. *, P < 0.05; ***, P < 0.001.

