Figure 5.
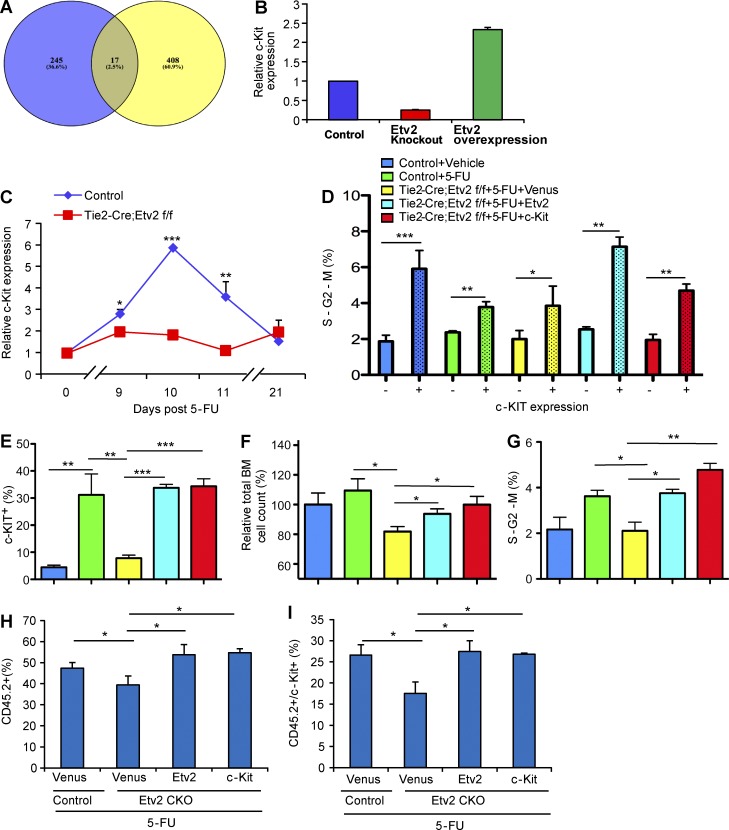
c-Kit is an ETV2 downstream target and responsible for ETV2-mediated HSPC recovery after 5-FU treatment. (A) Among 121 genes that were identified as putative direct targets of ETV2 in differentiated embryonic stem cells by Liu et al. (2015), 17 genes, including c-Kit, were annotated as genes related to regulation of cell proliferation. P-value was estimated using hypergeometric distribution. (B) Relative c-Kit expression levels, determined by microarray, in control, Etv2−/−, or Etv2-overexpressing embryoid body (in vitro differentiated embryonic stem) cells is shown (Liu et al., 2012). n = 2. (C) Tie2-Cre;Etv2 CKO or littermate control mice were injected with 250 mg/kg 5-FU i.p. At days 0, 9, 10, 11, and 21, flow cytometry with surface marker staining was performed to determine c-KIT expression levels on Lin− cells after 5-FU injury. Data are expressed as a relative c-KIT expression normalized to the littermate control day-0 group. n = 3–5 from two independent experiments. (D–G) Tie2-Cre;Etv2 CKO or littermate control mice were injected with 250 mg/kg 5-FU. BM mononuclear cells were collected 8 d later and infected with Venus, Etv2, or c-Kit lentivirus for 1 d, followed by cell count and flow cytometry analysis. Cell count was determined by using the CCK8 kit. Five different experimental groups are shown. Blue, control (no 5-FU); green, control + 5-FU; yellow, Tie2-Cre;Etv2 CKO + 5-FU + lentivirus-Venus (Venus expressing control lentivirus); cyan, Tie2-Cre;Etv2 CKO + 5-FU + lentivirus Etv2; and red, Tie2-Cre;Etv2 CKO + 5-FU + lentivirus c-Kit. (D) The percentage of c-KIT− and c-KIT+ cells in the S-G2-M phase in each group is shown. n = 9 from three independent experiments. (E) The frequency of c-KIT–positive cell population in each group is shown. n = 9 from three independent experiments. (F) The relative percentage of the cell counts in each group normalized to control (no 5-FU injury) is shown. n = 9 from three independent experiments. (G) The percentage of cells in the S-G2-M phase in each group is shown. n = 9 from three independent experiments. (H and I) Tie2-Cre;Etv2f/f or littermate control mice (CD45.2) were injected with 250 mg/kg 5-FU i.p. 7 d after injection, and 20,000 BM mononuclear cells were isolated and seeded onto a V-shape 96-well plate and infected with either lenti-Venus, -Etv2, or –c-Kit. Littermate control BM mononuclear cells were infected with lenti-Venus only. On the second day, cells were transplanted into 9 Gy–irradiated recipient mice (CD45.1) together with 20,000 mock-infected WT BM cells (CD45.1). Donor contribution (CD45.2) and c-Kit–positive cells from BM were analyzed by flow cytometry with surface marker and CD45.1 and CD45.2 3 d after transplantation. n = 6 from two independent experiments. *, P < 0.05; **, P < 0.01; ***, P < 0.001. Error bars indicate standard deviations.

