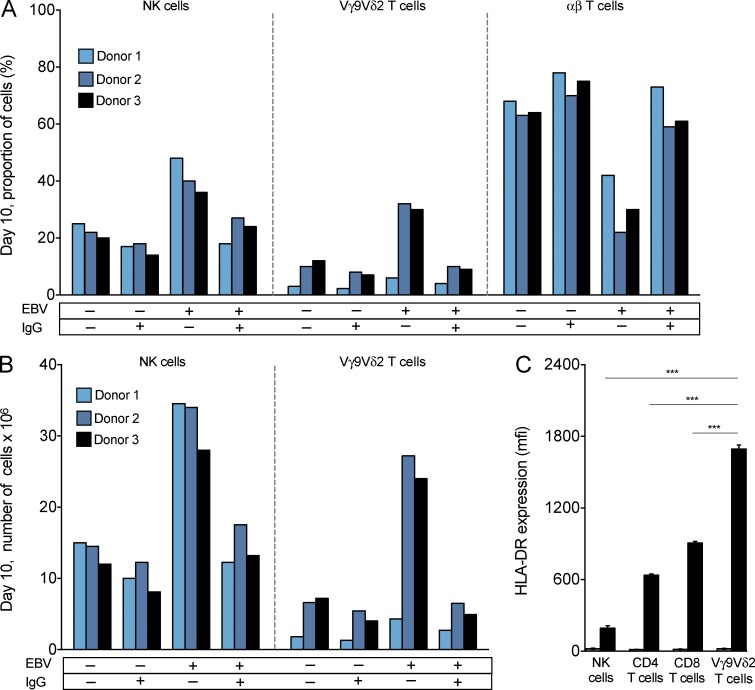
Figure 1.
NK cells and Vγ9Vδ2 T cells proliferate in response to latently infected EBV+ B cells. PBMCs were stimulated in culture for 10 d with IL2 and target cells. The targets were either EBV+ (denoted EBV +) or EBV− (denoted EBV −) Akata. They were either stimulated with anti-IgG (denoted IgG +) or not stimulated (denoted IgG −). (A) For day 10 cultures, histograms show the percentage of total cell number that were NK cells, Vγ9Vδ2 T cells, and αβ T cells. Shown are the results from one experiment, representing three performed. (B) Histograms show the absolute numbers of NK cells and Vγ9Vδ2 T cells in day 10 cultures. Shown are the results from one experiment, representing three performed. (C) Histogram comparing the mean fluorescence intensity (MFI ± SD; n = 4) for HLA-DR expression by NK cells, Vγ9Vδ2 T cells, CD4 T cells, and CD8 T cells at day 0 (gray bars) and day 10 (black bars) of PBMC stimulation with latent EBV+ Akata and IL2. Shown are the results from one experiment, representing four performed, two on donor 2 PBMCs and two on donor 3 PBMCs. Statistical significance in the difference between pairs of cell types was tested using ANOVA. Statistically significant differences (***, P < 0.0001) were observed between Vγ9Vδ2 T cells and each of the other three cell types.

