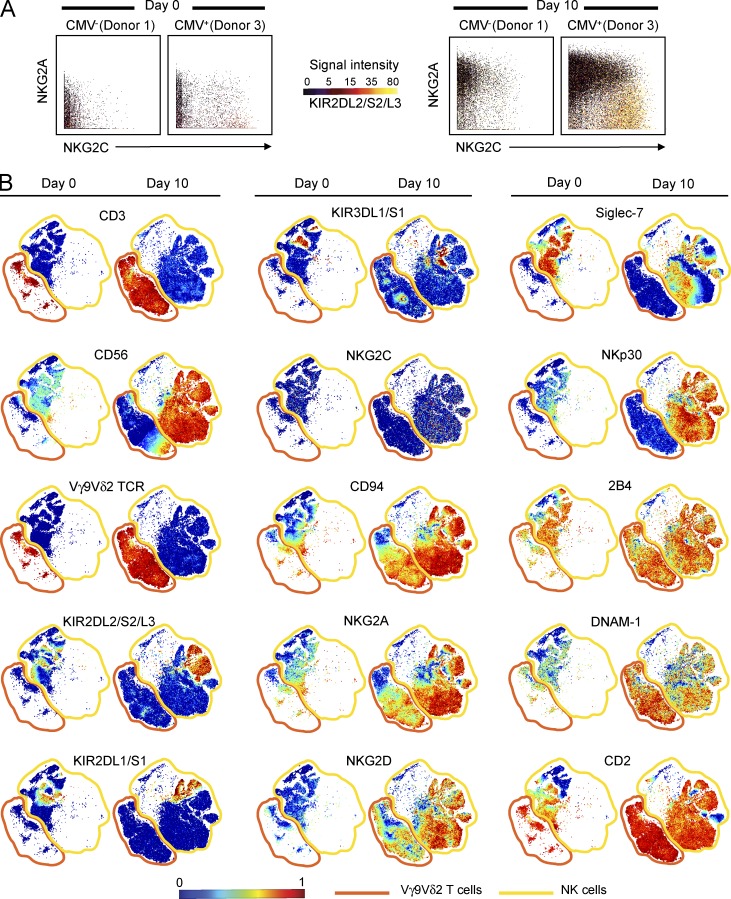
Figure 2.
EBV-stimulated NK cells and Vγ9Vδ2 T cells exhibit similar phenotypes of early differentiation. (A) Representative 3D plots showing the expression pattern of NKG2A, NKG2C, and KIR2DL3 by NK cells. NKG2A expression is given on the y axis, NKG2C expression on the x axis, and KIR2DL/3 expression by the color of the data points, as depicted under signal intensity. Analyzed are the day 0 and 10 cultures of PBMCs, from CMV− (donor 1) and CMV+ (donor 3) individuals, that were stimulated with Akata and IL2. Shown are the results from one experiment, representing three performed. (B) Representative viSNE maps of NK and Vγ9Vδ2 T cells at day 0 and NK cells and Vγ9Vδ2 T cells that proliferated during a 10-d stimulation of PBMCs with Akata cells and IL2. Each point in the viSNE map represents one cell; the points are colored to reflect the expression level of the indicated protein. Shown are the results from one experiment, representing three performed.

