Figure 3.
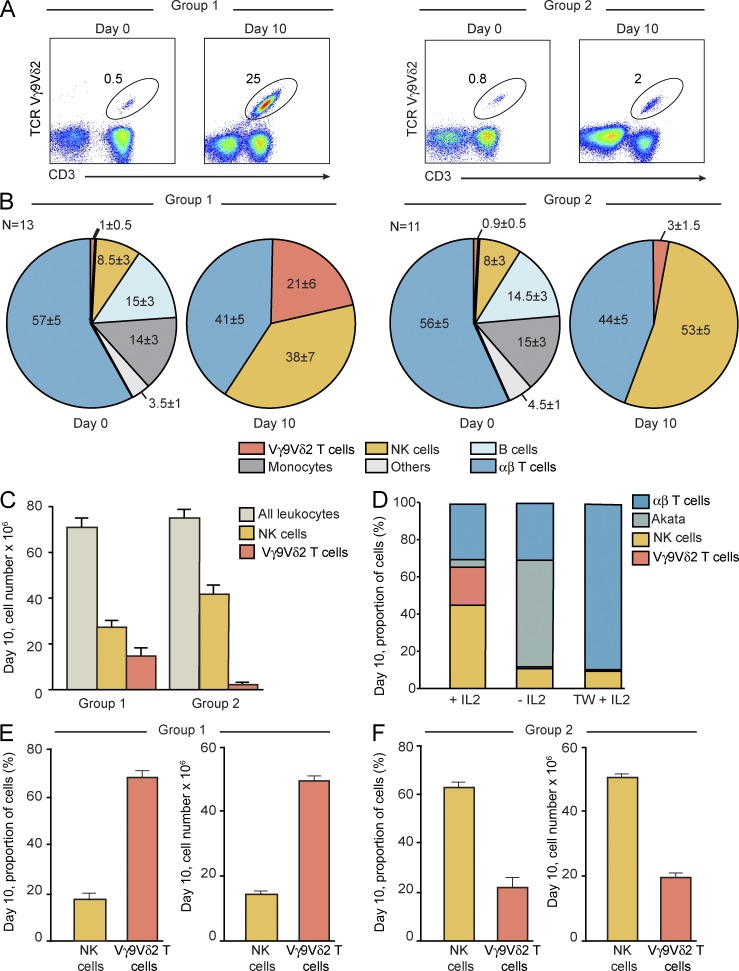
Bimodality in the human Vγ9Vδ2 T cell response to EBV. (A) 2D plots showing the size of the Vγ9Vδ2 T cell subpopulation in total unstimulated PBMCs and PBMCs after 10 d of culture with Akata cells. Representative data are shown for one group 1 donor (left; n = 13) and one group 2 donor (right; n = 11). (B) Pie charts showing the relative numbers (percentage of total cells) of Vγ9Vδ2 T cells, αβ T cells, NK cells, monocytes, B cells, and other cells in unstimulated PBMCs (day 0) and in PBMCs stimulated for 10 d with Akata cells (day 10). Mean values and SDs are given. For day 0 and day 10, the data for the group 1 donors (left; n = 13) and group 2 donors (right; n = 11) were analyzed separately. Statistically significant difference (P < 0.0001) was assessed between group 1 and group 2 Vγ9Vδ2 T cell proportions using ANOVA. (C) Histogram showing the absolute numbers of cells from cultures at day 10 for all leukocytes, NK cells, and Vγ9Vδ2 T cells. Mean values and SDs are given. The data for the group 1 donors (n = 13) and group 2 donors (n = 11) were analyzed separately. Statistically significant difference (P < 0.0001) was assessed between group 1 and group 2 Vγ9Vδ2 T cell numbers using ANOVA. (D) Histogram showing the proportions of Vγ9Vδ2 T cells, αβ T cells, NK cells, and Akata cells after 10-d culture of PBMCs with Akata cells. Three conditions were used: presence of IL2, absence of IL2, and presence of IL2 with separation of PBMCs from Akata targets by a Transwell (TW) system. PBMCs from three group 2 donors were studied. Shown is one representative of three experiments performed. (E and F) Histograms showing the proportions and absolute numbers of NK cells and Vγ9Vδ2 T cells after 10-d culture of PBMCs, depleted of CD4 and CD8 T cells, with Akata cells and IL2. Mean values ± SD are given. PBMCs from three group 1 donors (E) and three group 2 donors (F) were studied.

