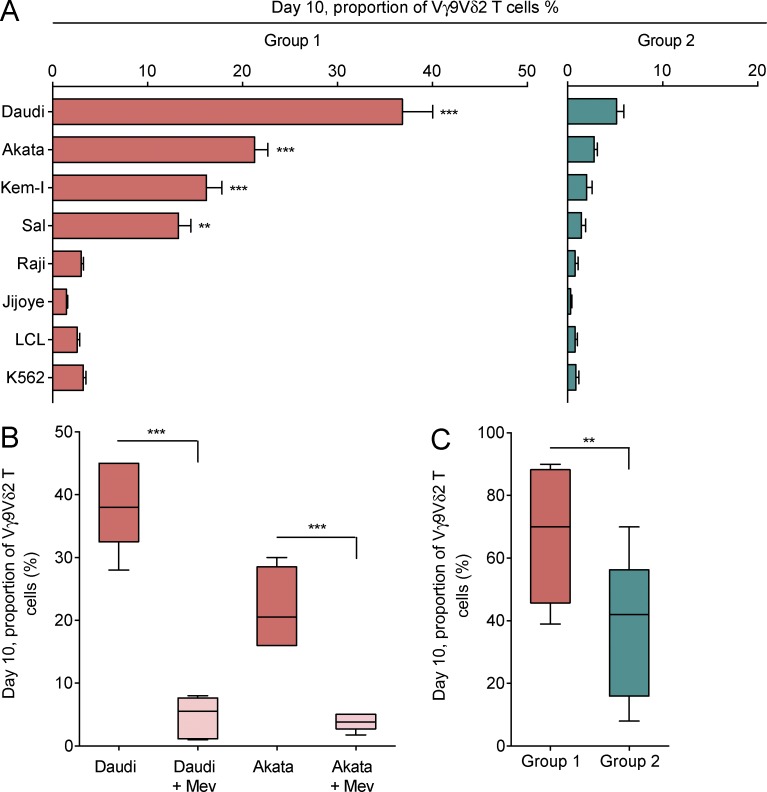
Figure 4.
Vγ9Vδ2 T cells from group 1 donors proliferate in response to type I EBV infection. (A) PBMCs from six group 1 donors (orange) and six group 2 donors (green) were stimulated in culture for 10 d with IL2 and target cells. The targets were type I BL cell lines (Daudi, Akata, and Kem-I), the Wp-restricted BL cell line Sal, type III BL cell lines (Raji and Jijoye), and type III EBV-infected LCL and K562. Bar graphs give the proportion of Vγ9Vδ2 T cells after the 10-d culture. Mean values ± SEM are also given. Statistically significant difference between each experimental target cell and the negative control, K562 cells, was assessed using ANOVA (**, P < 0.008; ***, P < 0.0001). (B) PBMCs from six group 1 donors were stimulated in culture for 10 d with IL2 and target cells. The targets were Daudi and Akata, either preincubated (light pink) or not preincubated (orange) for 24 h with 80 µM mevastatin (Mev). Boxes and whiskers represent the proportion of Vγ9Vδ2 T cells after the 10-d culture. Statistical significance in the difference between experiment and control was assessed using ANOVA (***, P < 0.0001). (C) Boxes and whiskers represent the proportion of Vγ9Vδ2 T cells after 10-d culture of PBMCs from eight group 1 donors (orange) and eight group 2 donors (green), in the presence of 100 µM IPP and IL2. Statistical significance in the difference between the two groups was assessed using the unpaired two-tailed Student’s t test (**, P < 0.01).

