Figure 5.
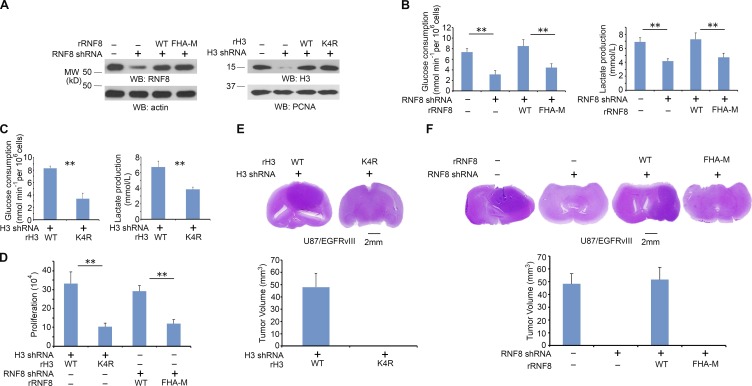
RNF8-mediated histone H3 ubiquitylation promotes the glycolysis and tumorigenesis. (A) RNF8 and histone H3.3 in U87/EGFRvIII cells were depleted with expression of their shRNA and reconstituted with expression of WT rRNF8, rRNF8 FHA-M, WT histone rH3.3B, or histone rH3.3B-K4R. Total cell lysates were prepared for expression levels of RNF8 and actin control. LS-soluble chromatin extracts were prepared for detection of H3 and PCNA control. Immunoblotting analyses were performed with the indicated antibodies. Experiments were repeated three times. WB, Western blot. (B) U87/EGFRvIII cells with RNF8 depletion were reconstituted with or without expression of WT rRNF8 or rRNF8 FHA-M. Media were collected for analysis of glucose consumption (left) or lactate production (right), which was normalized by cell numbers (per 106). (C) U87/EGFRvIII cells with histone H3.3 depletion were reconstituted with expression of WT histone rH3.3B or rH3.3B-K4R. Media were collected for analysis of glucose consumption (left) or lactate production (right), which was normalized by cell numbers (per 106). (D) A total number of 3 × 10⁴ U87/EGFRvIII cells with histone H3.3 depletion and reconstituted expression of WT histone rH3.3B or rH3.3B-K4R or with RNF8 depletion and reconstituted expression of WT rRNF8 or rRNF8 FHA-M were plated and counted 7 d after seeding in DMEM with 0.5% bovine calf serum. (B–D) Data represent the means ± SD of three independent experiments. **, P < 0.001 by Student’s t test. (E and F) 5 × 10⁵ U87/EGFRvIII cells with H3.3 depletion and reconstituted expression of WT histone rH3.3B or rH3.3B-K4R (E) or RNF8 depletion and reconstituted expression of WT rRNF8 or rRNF8 FHA-M (F) were intracranially injected into athymic nude mice (n = 7 per group). After 2 wk, the mice were sacrificed and tumor growth was examined. H&E-stained coronal brain sections showed representative tumor xenografts (top). Tumor volumes were calculated (bottom). Data represent the means ± SD of seven mice in each group.

