Figure 6.
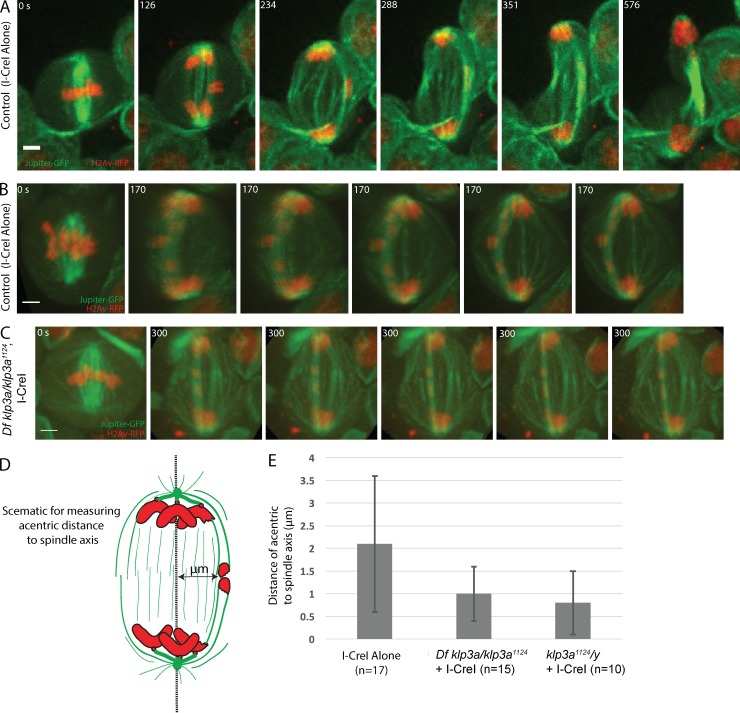
Acentric segregation along peripheral interpolar microtubules is disrupted in klp3a mutants. (A) Still images from a time-lapse movie of a mitotic neuroblast with I-CreI induced acentrics migrating poleward on an arch of microtubules on the periphery of spindle. (B) Still frames from a 3D rendering of a control I-CreI expressing neuroblast showing acentrics (red) positioned to the outer edge of spindle midzone during anaphase, while associated with an arch of pole-pole microtubules (green). (C) Still frames from a 3D rendering (Video 8) from a female Df klp3a/ klp3a1124 neuroblast showing that acentrics are within the middle of spindle midzone during anaphase. Bars, 2 µm. Time in seconds. (D) Schematic showing measurements of the maximal distance of newly separated acentrics from a medial line drawn between centrosomes. (E) Bar graphs showing the maximal distance (μm) of acentric from a medial line between centrosomes to the outer edge of the anaphase spindle midzone in control and Klp3a-defective neuroblast. Error bars represent one SD from the mean.

