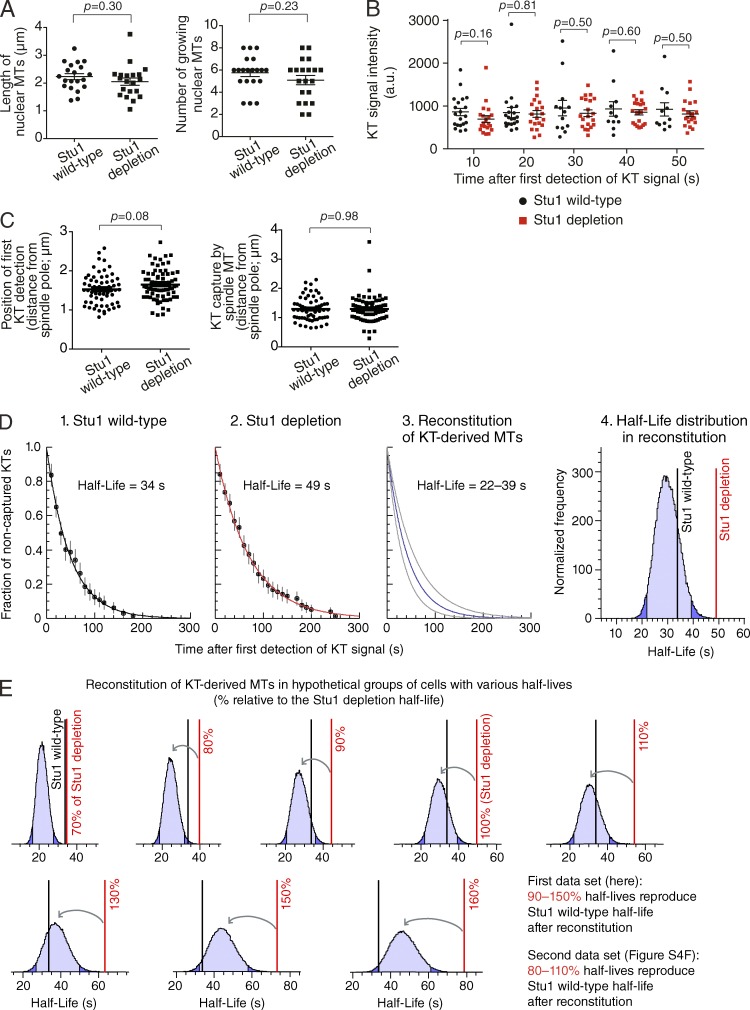
Figure 4.
Implication that KT-derived MTs facilitate KT capture by spindle MTs. (A) There is no significant difference in the length or number of nuclear MTs in Stu1 wild-type and Stu1-depleted cells. STU1+ (T11802) and stu1–anchor-away (T11766) cells with NIC96-4×mCherry GFP-TUB1 cells were treated, and images were acquired as in Fig. 3 A. Nic96 signals were used to identify the periphery of nucleus. The p-value (two tailed) was obtained by an unpaired t test. The maximum length (left) and the maximum number (right) of nuclear MTs, which were observed during 5 min, are plotted in individual cells (n = 20 in each condition). (B) There is no significant difference in KT signal intensity between Stu1 wild-type and Stu1-depleted cells. STU1+ (T11242) and stu1–anchor-away (T11230) cells with MTW1-4×mCherry NDC80-4×mCherry YFP-TUB1 cells were treated and analyzed as in A. The intensity of the KT signal is plotted at each time point (time after the first appearance of the KT signal) in individual cells. n = 20 at each time point and in each condition, except for 30 s (n = 13), 40 s (n = 11), and 50 s (n = 11) in Stu1 wild-type. a.u., arbitrary units. (C) There is no significant difference in the position of the KT appearance or capture by spindle MTs between Stu1 wild-type and Stu1-depleted cells. T11242 and T11230 cells were analyzed as in B. The distances from a spindle pole of first KT appearance (left) and KT capture by spindle MTs (right) are plotted for individual events (n = 60 and 74 for Stu1 wild-type and Stu1 depletion, respectively). The mean ± standard error is shown in each group of cells. (D) Computational reconstitution of KT-derived MTs in Stu1-depleted cells generated decline curves of noncaptured KTs, which are consistent with Stu1 wild-type cells. Graphs 1 and 2 show the decline curve of noncaptured KTs observed in vivo in Stu1 wild-type and Stu1-depleted cells, respectively (based on Fig. S3 A). Lines show best-fitting simple exponential decay curves, and error bars represent standard errors of proportion. Graph 3 shows the range of decline curves of noncaptured KTs based on results from 100,000 runs of computational reconstitution of KT-derived MTs. In each run, KT-derived MTs were added to a group of Stu1-depleted cells (see Fig. S4 D). The gray curves represent the central 95% of all simulation runs. The corresponding range of half-lives is also shown. Graph 4 shows the distribution of half-lives of noncaptured KTs after the computational reconstitution of KT-derived MTs. Light blue areas represent the range within the 95% CI, and dark blue areas show the range outside of it. Black and red vertical lines show the half-lives of Stu1 wild-type and Stu1-depleted cells, respectively. See Fig. S4 E for analyses of the second dataset. (E) Stu1-depleted cells show a delay in KT capture whose extent falls within a relatively narrow range expected from a lack of KT-derived MTs. KT-derived MTs were computationally reconstituted (100,000 runs in each condition) in hypothetical groups of cells where half-lives of noncaptured KTs (red vertical lines) are 70–160% of the half-life (49 s) in Stu1-depleted cells observed in vivo. Light blue areas, dark blue areas, and black vertical lines are as in D. The y axis of each graph shows normalized frequency. See Fig. S4 F for analyses of the second dataset.

