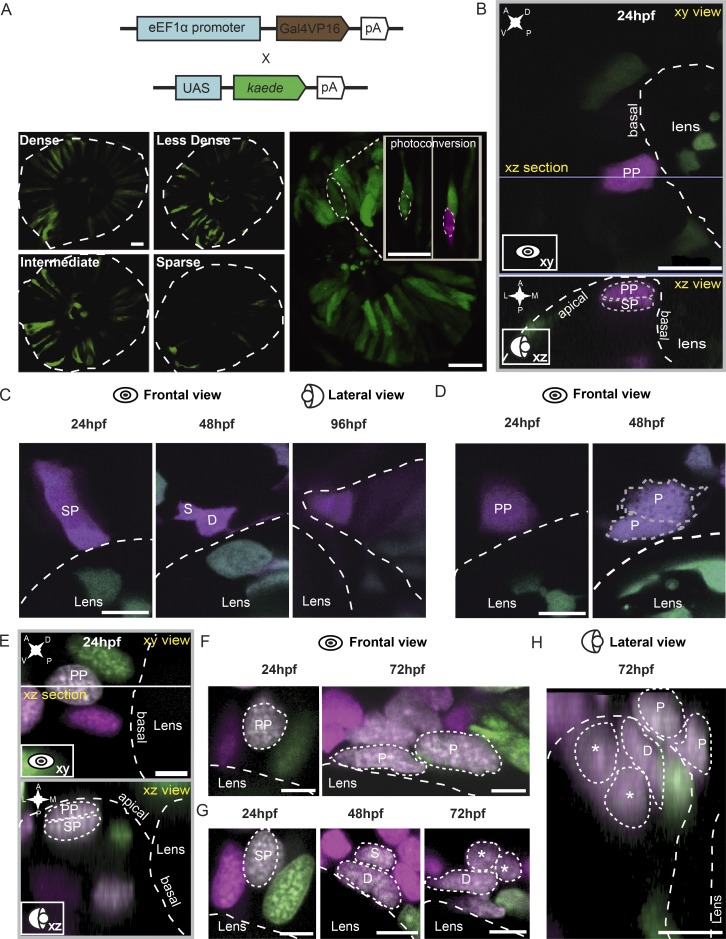
Figure 4.
Identification of SPs. (A) Individual retinal progenitors were mosaically labeled to different levels in the transgenic fish Tg(eEF1α:Gal4VP16::UAS:kaede). At 24 hpf, individual cells were labeled by Kaede photoconversion. (B) Representative images of peripheral cells located in the first and second layers labeled by photoconverted Kaede in the 24 hpf optic cup from the frontal (xy) and lateral view (xz). (C) Representative images of a peripheral cell of the second layer (SP) dividing into one dormant CMZ tip cell (D) and one RSC (S) at 48 hpf and further generating the cell cluster of the CMZ tip at 96 hpf. (D) Representative images of a peripheral cell of the first layer (PP) dividing into two pigmented cells (P) at 48 hpf. (E) Representative images of peripheral cells of the first and second layers labeled by photoconverted Kaede in the 24-hpf optic cup from the frontal (xy) and lateral view (xz). (F) Representative images of a peripheral cell of the first layer (the same cell as in E) producing two pigmented cells at 72 hpf. (G) Representative images of a peripheral cell of the second layer dividing into one dormant CMZ tip cell and an RSC. The dormant cell did not divide further, whereas the RSC divided into two cells (marked by asterisks) at 72 hpf. (H) The dorsal view of the cells in F and G. Asterisks indicate two daughter cells derived from RSCs. White and gray dashed lines outline the boundaries of retinas, lenses, and cells. A, anterior; D, dorsal; L, lateral; M, medial; P, posterior; V, ventral. Bars: (A and B) 20 µm; (C–H) 5 µm.

