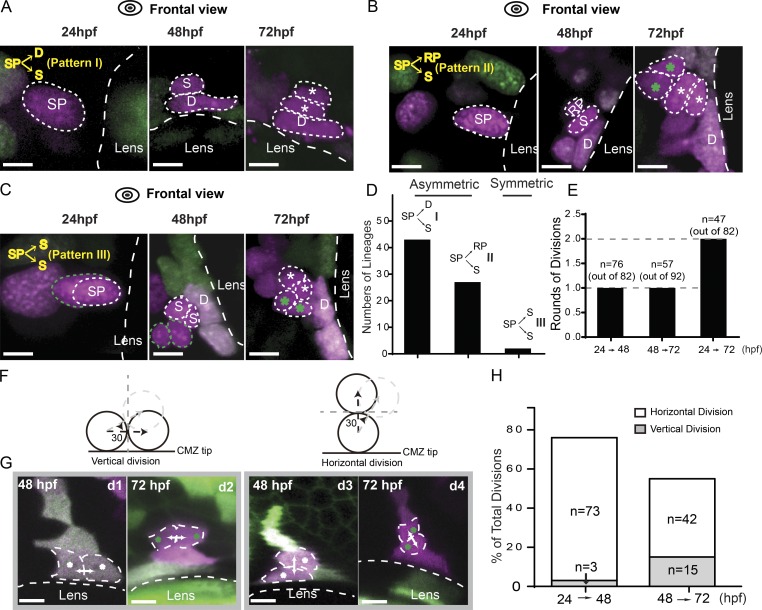
Figure 5.
Lineage patterns of RSC generation. (A) Representative images of the lineage pattern I showing one SP dividing into one dormant CMZ tip cell (D) and one RSC (S) between 24 and 48 hpf. From 48 to 72 hpf, the dormant CMZ tip cell did not divide any more, whereas the RSC continued to proliferate into more cells (indicated by asterisks). (B) Representative images of the lineage pattern II showing that one SP divided into one RSC and one retinal progenitor (RP) from 24 to 48 hpf. Between 48 and 72 hpf, the RSC produced two more cells closer to one dormant CMZ tip cell, whereas the retinal progenitor gave rise to two cells (indicated by green asterisks) far away from the dormant cell. (C) One SP cell divided into two RSCs between 24 and 48 hpf, and both of them divided once during 48 to 72 hpf to form the CMZ tip region. (D) Plot for the numbers of different lineage patterns (n = 43, 27, and 2 from I–III). Patterns I and II were asymmetric, whereas Pattern III was symmetric. (E) Plot showing the numbers of cell divisions that SPs completed within various time windows, including 24–48 hpf, 48–72 hpf, and 24–72 hpf. On average, each cell finished one round of cell divisions every 24 h. (F) Schematics of vertical and horizontal divisions. (G) Representative images of vertical (d 1 and d2) and horizontal divisions (d3 and d4) at 48 and 72 hpf. The white arrows represent cell migration directions. (H) Plot showing the frequency of the vertical and horizontal divisions within 24–48 hpf and 48–72 hpf. Dashed lines outline the boundaries of the lens and cells. Bars, 5 µm.

