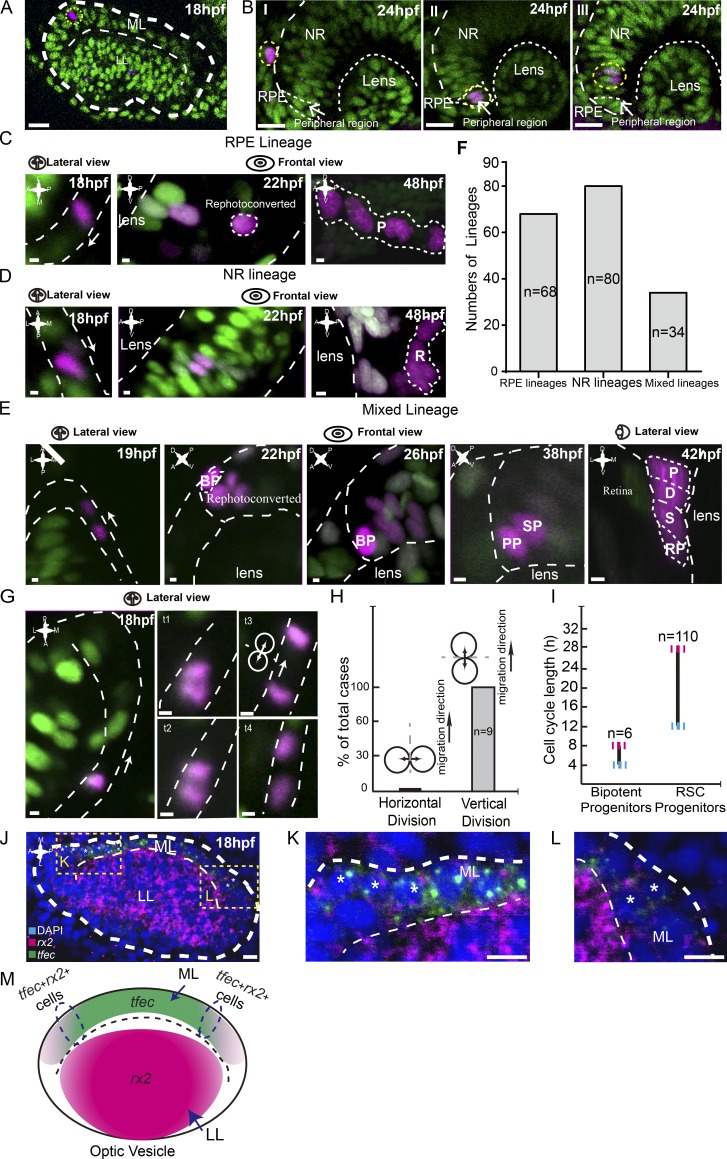
Figure 6.
Bipotent progenitors as the embryonic origin of SPs. (A) An example of a single photoconverted cell (in magenta) in the ML of the optic vesicle at 18 hpf. Yellow dashed lines indicate traced clones. (B) Representative clones derived from single cells labeled at 18 hpf reached distinct final destinations of the optic cup at 24 hpf, including the RPE, peripheral region, and NR. (C–E) Three types of lineages originated from individual cells in the ML. RPE lineages (in C) contained RPE cells only (n = 68). NR lineages (in D) were composed of NR cells only (n = 80). Mixed lineages (in E) were composed of pigmented cells (P), dormant CMZ tip cells (D), RSCs (S), and retinal progenitors (RPs; n = 34). Mixed lineages were derived from bipotent cells (BPs). To distinguish from neighboring cells, bipotent cells were rephotoconverted in brighter red by exposure to the UV laser once more. (F) Plot of numbers of different lineages derived from individual 18-hpf cells in the ML, including RPE lineages, NR lineages, and mixed lineages. (G) Time lapse of the representative vertical division by the migrating cell in the ML. White arrows represent cell migration direction. (H) Plot showing all migrating cells in the ML divided vertically. (I) Plot showing that the cell cycle length of bipotent progenitors ranges from 4–8 h (n = 6), whereas SPs, the bipotent progenitors’ daughters, had a cell cycle length of between 12 and 28 h (n = 110). (J) Double FISH showing a set of cells in the ML expressing both rx2 and tfec, suggesting the mixed lineage state of RPE and RSCs. Yellow dashed lines indicate zoomed areas. (K and L) Zoomed images of the regions in J marked with yellow dashed squares. Asterisks indicate cells expressing both tfec and rx2 signals. (M) A schematic of the expression patterns of tfec and rx2 in the optic vesicle at 18 hpf. Some cells in the region (circled by dashed lines) express both genes. Green cells, nlsKaede; magenta cells, photoconverted nlsKaede; A, anterior; D, dorsal; L, lateral; M, medial; P, posterior; V, ventral. White dashed lines outline the boundaries of retinas, lenses, LLs, MLs, cells, and clones. The white arrows in C, D, E, and G indicate the migration directions of cells in the ML. Bars: (A and B) 20 µm; (C–E and G) 2.5 µm; (J–L) 10 µm.

